The Current View
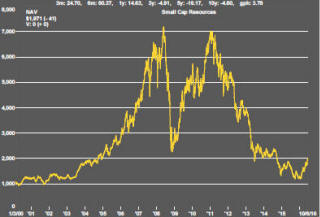
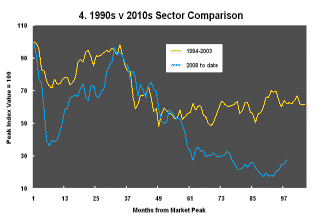
A lengthy downtrend in sector prices had given way to a relatively stable trajectory after mid 2013 similar to that experienced in the latter part of the 1990s and first few years of the 2000s.
The late 1990s and early 2000s was a period of macroeconomic upheaval during which time sector pricing nonetheless proved relatively stable. That remains a possible scenario for sector prices.
Relative stability suggests a chance for companies genuinely adding value through development success to see their share prices move higher. This was the experience in the late 1990s and early 2000s.
The lower equity prices fall - and the higher the cost of capital faced by development companies - the harder it becomes to justify project investments.
Has Anything Changed?
A 1990s scenario remains the closest historical parallel although the strength of the US dollar exchange rate since mid 2014 has added an unusual weight to US dollar prices.
The first signs of cyclical stabilisation in sector equity prices have started to show. This has meant some very strong ‘bottom of the cycle’ gains but only after prices have already fallen by 70% or more in many cases leaving prices still historically low.
Funding for project development may have passed its most difficult phase at the end of 2015 with signs of deals being done and evidence that capital is available for suitably structured transactions.
Key Outcomes in the Past Week
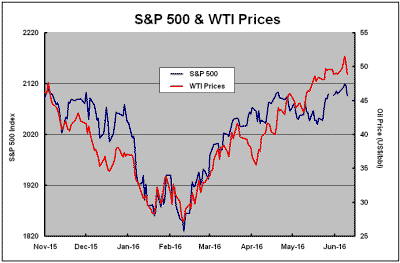
An apparently benign investment environment was dramatically transformed on Friday when nervousness over the ‘Brexit’ vote on 23 June surfaced. Stock prices also began to show their linkage with oil prices once again.
The potential crises of the past year that might have come from Chinese or Greek debt excesses or oil patch corporate collapses had subsided in importance in recent months.
The UK vote on European Union membership hovered in the background without seemingly having an adverse impact on markets.
A widespread belief that Britons would vote to stay within the union had fostered a possibly overly optimistic market calmness. On Friday, however, a newspaper poll showed an unexpected majority of voters in favour of leaving.
U.S. and German bond yields fell to as low as they
have been in recent years when historically low rates have already been
plumbed.
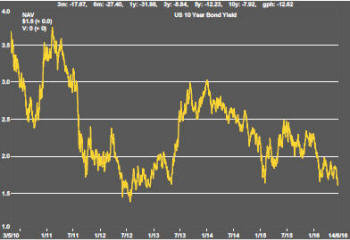
The positive valuation effects of low bond yields should buoy equity prices but, on this occasion, they were driven by fear and worries about the impact of an EU exit by Britain on the financial sector.
Adding to financial sector woes, lower bond yields would also damage bank earning prospects.
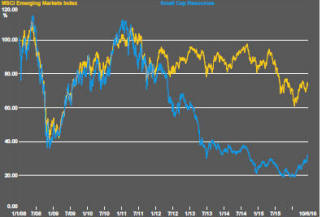
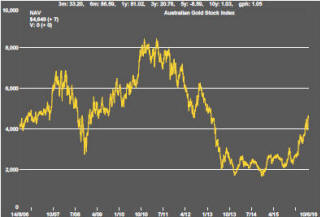
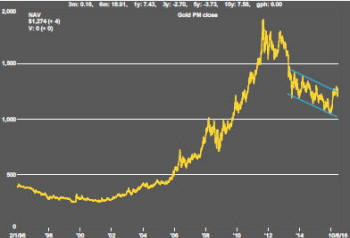
A race for safety also meant a stronger U.S. dollar. Despite the dollar’s strength, but consistent with the pursuit of safety, gold prices moved higher. The currency move damaged commodity prices and their related equities.
These latter moves - leaving prices within ranges in which they had been trading in recent weeks - were less dramatic than the reappraisal of risk implied by the change in bond yields.
Once again, the balance of forces seemed to tilt further away from a near term interest rate rise by the U.S. Federal Reserve when it meets in June.
With barely a few days to go before UK voters ago to the polls, markets will not have long to wait before knowing the result of the EU exit vote.
The more tortuous aspect of the vote seems likely to be the ensuing two year negotiation allowed for under the EU treaty to define exactly how the UK will disengage from its fellow members.
An added uncertainty, against this backdrop, will come from the possibility of other countries cancelling their membership (and the resulting disintegration of the union).
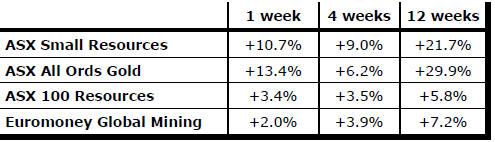
Gold aside, the largest gains in sector equity
prices are coming from stocks classified as Phase I and Phase III by
PortfolioDirect.
The large cap companies within Phase III benefit from the flow of institutional funds in response to changes in relative risk across market sectors. The smallest stocks within the sector benefit from the bottom of the cycle leverage where they have been able to attract private investor interest.
Among the least responsive stocks recently have been those classified within the PortfolioDirect framework as being in Phase II. These rely mostly on successfully completing project development or finalising funding for their investment attractiveness.
Remaining examples of good quality exploration endeavours still trapped within cyclical low price ranges suggest further investment opportunities among the Phase I companies.
The cyclical position being described in the PortfolioDirect macro analysis suggests the market is at a very early stage in the bottoming process. Price surges associated with the smallest stocks are not proving sustainable. This suggests that, until there is a stronger infusion of new money further along the cyclical path, a “buy and hold” strategy will be less than optimal.
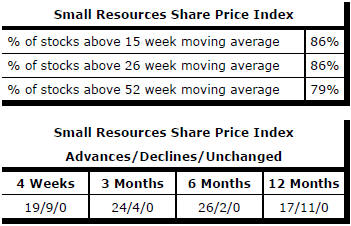
Market Breadth Statistics