The Current View
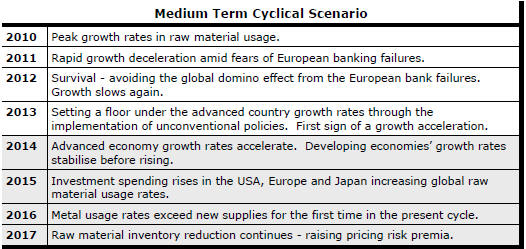
Growth in demand for raw materials peaked in late 2010. Since then, supply growth has continued to outstrip demand leading to inventory rebuilding or spare production capacity. With the risk of shortages greatly reduced, prices have lost their risk premia and are tending toward marginal production costs to rebalance markets.
To move to the next phase of the cycle, an acceleration in global output growth will be required to boost raw material demand by enough to stabilise metal inventories or utilise excess capacity.
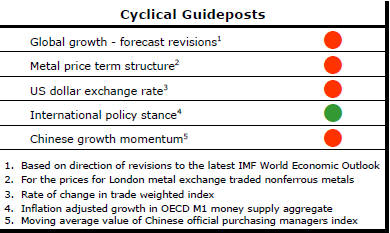
The PortfolioDirect cyclical
guideposts suggest that the best possible macroeconomic circumstances for
the resources sector will involve a sequence of upward revisions to
global growth forecasts, the term structure of metal prices once again
reflecting rising near term shortages, a weakening US dollar, strong money
supply growth rates and positive Chinese growth momentum. Only one of
the five guideposts is "set to green" suggesting the sector remains confined
to the bottom of the cycle .
Has Anything Changed?
Throughout 2014, PortfolioDirect had been characterising the cyclical position as ’Trough Entry’ with some expectation that by the end of 2014 an exit would be evident. Until very late in the year, the evidence supported that possibility before conditions took several backward steps.
The absence of a growth acceleration among the major economic regions is contributing to the flagging momentum. A stronger US dollar is also imparting a downward bias to US dollar denominated prices presently. This is looking less like a temporary move than a multiyear change of direction.
The flow of metal market statistics is pointing to a marked slowing in usage growth in 2015.
IMF Growth Scenario Has Warning for Mining
Investments
In delivering its world economic outlook update during the past week, the
International Monetary Fund reiterated its observation that the world has
most likely entered a prolonged period of slow growth. Olivier Blanchard, the head of research at the Fund, described this as an
environment in which advanced economies will grow at around 2% a year with
emerging market economies growing at around 4%.
Olivier Blanchard, the head of research at the Fund, described this as an
environment in which advanced economies will grow at around 2% a year with
emerging market economies growing at around 4%.
In this context, the Fund has once again delayed the expected timing of a future growth acceleration. A pick-up is currently expected in 2016 although, as in recent years, there is a risk of the forecast being pared back as the time approaches. Moreover, by historical standards the size of the acceleration is quite modest.
Realisation of this outlook would have important implications for resource sector investment decision making. Raw material demand grows most strongly when growth is accelerating. In the absence of a growth acceleration, metal usage growth is likely to be below average in the years ahead. That would feed into market balances, an important driver of prices.
Market forecasts (and company investor pitches) based on historically average rates of growth which have typically included periods of rapidly accelerating demand will prove overly optimistic under these circumstances and should be heavily discounted when proffered as a basis for an investment decision.
Iron Ore Prices Hit AUD
The strong connection between the Australian dollar and movements in iron
ore prices dates from the opening of markets in Asia to speculation about
the future direction of iron ore prices.

Iron ore prices are linked to the currency via their impact on Australia's balance of payments. In that regard, they have an effect which would be no different from any other good or service sold in overseas markets.
Less directly, iron ore prices have become a trading proxy for the state of the Chinese economy. The Australian dollar is similarly used by international investors and traders. This common bond also implies a high correlation in returns.
While physical balances in the iron ore market are one factor affecting prices, any improvement in Chinese economic performance is likely to result in a stronger Australian dollar and higher iron ore prices now that both are subject to the same speculative flows.
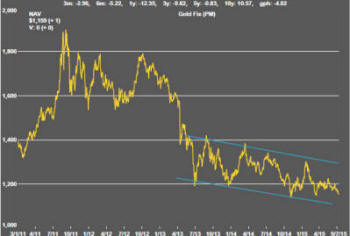
Gold Not Needed
All's right with the world if the price of gold is any guide. The gold
price has been trending gradually lower for over two years.
A strengthening U.S. dollar will have been one of the more obvious contributing influences on this outcome.
The PortfolioDirect approach models the
gold price as the product of a wealth effect and a relative price effect.
The wealth effect contributes to ongoing rises in demand but has been eroded at the margin by slower global economic growth and, within that outcome, less favourable economic conditions in many locations in which gold is a preferred store of value.
While global interest rates have generally been low, investment returns in bond and equity markets have been relatively strong reducing the relative price incentive to hold precious metals.
Most recently, the crisis in Europe over Greek debt and the collapse in Chinese stock prices have not caused greater recourse to gold as a safe haven store of value as might have been expected. In this, the gold market is signaling that relative prices have not moved by enough to change the evident trend.