The Current View
Growth in demand for raw materials peaked in late 2010. Since then, supply growth has continued to outstrip demand leading to inventory rebuilding or spare production capacity. With the risk of shortages greatly reduced, prices have lost their risk premia and are tending toward marginal production costs to rebalance markets.
To move to the next phase of the cycle, an acceleration in global output growth will be required to boost raw material demand by enough to stabilise metal inventories or utilise excess capacity.
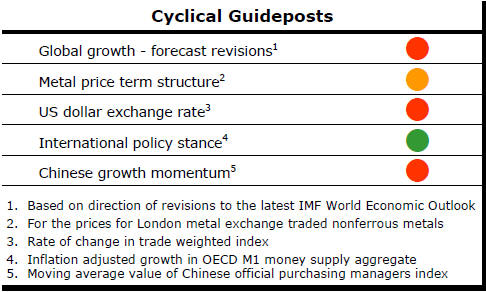
The PortfolioDirect cyclical
guideposts suggest that the best possible macroeconomic circumstances for
the resources sector will involve a sequence of upward revisions to
global growth forecasts, the term structure of metal prices once again
reflecting rising near term shortages, a weakening US dollar, strong money
supply growth rates and positive Chinese growth momentum. Only one of
the five guideposts is "set to green" suggesting the sector remains confined
to the bottom of the cycle .
Has Anything Changed? - Updated View
Since mid 2014, the metal market cyclical position has been characterised as ‘Trough Entry’ as prices have remained in downtrend with all but one of the PortfolioDirect cyclical guideposts - the international policy stance - flashing ‘red’ to indicate the absence of support.
The absence of a global growth acceleration, a stronger dollar and flagging Chinese growth momentum remain critical features of the current cyclical positioning.
Through February 2016, the first signs of cyclical improvement in nearly two years started to emerge. After 15 months of contango, the metal price term structure shifted to backwardation reflecting some moderate tightening in market conditions.
The metal price term structure is the most sensitive of the five cyclical guideposts to short term conditions and could, consequently, quickly reverse direction. Nonetheless, this is an improvement in market conditions and the guidepost indicator has been upgraded to ‘amber’ pending confirmation of further movement in this direction.
European Policy Changes Flag Growth Headaches
The critical pick-up in growth momentum needed to speed up the duration of
the current metal price cycle remains absent. There was further evidence of
this after the latest European Central Bank deliberations last week.
In raising hopes (much as it has done before) that
it was going to take fresh steps to improve economic outcomes, the ECB once again
highlighted the limitations of its power to affect economic outcomes. 
After the latest meeting of its governing council, the ECB said it had decided on a “comprehensive package” designed to “further ease financing conditions, stimulate new credit provision and thereby reinforce the momentum of the euro area’s economic recovery”.
A key objective of the “substantial monetary stimulus” was to secure an acceleration in inflation to 2% “without undue delay”.
Intimating in its formal statement that more could be done later, the ECB said it “will continue to monitor very closely the evolution of the outlook for price stability over the period ahead”.
Three aspects of its deliberations stood out in the prepared commentary released after the meeting.
Firstly, the ECB clearly views the risks to euro area growth as being tilted to the downside. The move to even modest growth outcomes of 1.7% in 2017 and 1.8% in 2018 is at the upper end of its expectations.
Secondly, while growth and inflation outcomes are connected, preventing a downward inflation spiral is the more urgent priority. This is a significant negative signal for the resources sector.
Thirdly, another negative is the ECB’s pessimism about the willingness of the majority of member countries to reduce structural impediments to growth.
ECB president Mario Draghi promised that “rates will stay low, very low, for a long period of time” but his added remark that “we don’t anticipate that it will be necessary to reduce rates further” seemed to take the steam from his efforts to persuade markets that more powerful measures were going to be there if needed. Contrary to the remarks in the written statement which appeared to cheer markets, Draghi’s unscripted comments seemed to downplay the willingness of the bank to do more.
Whether this was a mistake or a necessary sop to those on the council opposed stronger action, it raised questions about the effectiveness of central bank communications, a topic which has been more widely discussed in recent months not only in Frankfurt but also in Washington, Tokyo and Beijing.
With the major central banks placing increasing emphasis on the importance of forward guidance in helping to achieve their policy aims, they are now being judged on how well they perform that task and, importantly, what they are trying to say about their future actions.
Last week’s mixed messages left markets in doubt and, almost immediately, equity prices gave up all the gains made immediately prior to Draghi speaking. Against the expectations of most analysts that the euro would fall, it rebounded 1.7% against the dollar after the press conference ended.
The newly announced package is highly accommodating. Whether it is sufficient to achieve the bank’s policy objectives remains hard to tell since the central bank is ploughing ground never before tilled.
Draghi appears to have painted himself into a corner. If there is evidence he has not done enough, he will have to admit failure publicly rather than take credit for being willing to do more. In doing that, he will also have to admit at least implicitly that the bank does not fully understand the transition mechanism with which it is dealing.
Just a few words out of place may have jeopardised much of what the bank had hoped to achieve.
Chinese Loan Growth Sustained
Loans outstanding in China at the end of December (reported on 1 March 2016)
were 13.4% higher than in the corresponding period a year earlier. The trend
growth rate (shown in dark
 blue
in the chart) has increased by slightly over one percentage point over the
year while the month to month growth rates have shown increased
volatility.
blue
in the chart) has increased by slightly over one percentage point over the
year while the month to month growth rates have shown increased
volatility.
Chinese lending could have been pared back somewhat without affecting economic activity due to the historic waste in private and public spending.
The rate of lending growth remains consistent with a stronger output growth outcome than has been reported or is expected in the year ahead suggesting misallocation of funds continues.