The Current View
Growth in demand for raw materials peaked in late 2010. Since then, supply growth has continued to outstrip demand leading to inventory rebuilding or spare production capacity. With the risk of shortages greatly reduced, prices have lost their risk premia and are tending toward marginal production costs to rebalance markets.
To move to the next phase of the cycle, an acceleration in global output growth will be required to boost raw material demand by enough to stabilise metal inventories or utilise excess capacity.
The PortfolioDirect cyclical
guideposts suggest that the best possible macroeconomic circumstances for
the resources sector will involve a sequence of upward revisions to
global growth forecasts, the term structure of metal prices once again
reflecting rising near term shortages, a weakening US dollar, strong money
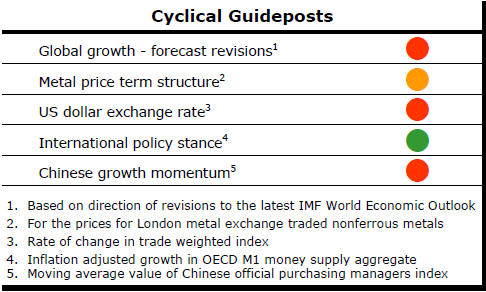
supply growth rates and positive Chinese growth momentum. Only one of
the five guideposts is "set to green" suggesting the sector remains confined
to the bottom of the cycle .
Has Anything Changed? - Updated View
Since mid 2014, the metal market cyclical position has been characterised as ‘Trough Entry’ as prices have remained in downtrend with all but one of the PortfolioDirect cyclical guideposts - the international policy stance - flashing ‘red’ to indicate the absence of support.
The absence of a global growth acceleration, a stronger dollar and flagging Chinese growth momentum remain critical features of the current cyclical positioning.
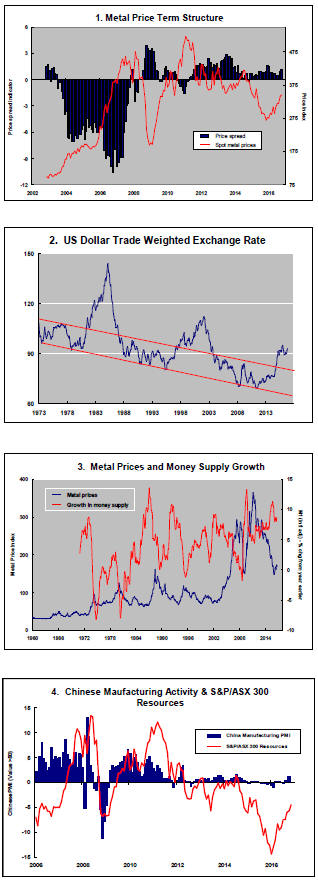
Through February 2016, the first signs of cyclical improvement in nearly two years started to emerge. After 15 months of contango, the metal price term structure shifted to backwardation reflecting some moderate tightening in market conditions.
The metal price term structure is the most sensitive of the five cyclical guideposts to short term conditions and could, consequently, quickly reverse direction. Nonetheless, this is an improvement in market conditions and the guidepost indicator has been upgraded to ‘amber’ pending confirmation of further movement in this direction.
US Elections - Resource Sector Benefits
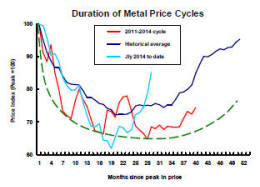
The most dramatic change in sector cyclical positioning for several years
occurred last week. For the first time since the cyclical downturn
commenced in early 2011, metal prices can be described as above average for
the duration of the cycle.
Last week’s PortfolioDirect report described the potential impacts of a Clinton or Trump win in the U.S. presidential election. LINK
The Trump election brings with it certain expectations but, more historic than the Trump election itself, is the Republican Party ascendancy in Washington.
With the White House and both houses of Congress coming under Republican Party control, the long lamented Washington policy logjam stands a chance of coming to an end.
Corporate tax reform, higher infrastructure spending and less regulation of the financial sector are some of the policy impacts likely to emerge from the election in the near future.
The exact nature of these changes needs clarification. Candidate Trump acknowledged that some of his policy positions were ambit claims subject to negotiation after his election.
Despite the lack of detail, expectations have risen for fiscal and regulatory policies to help support U.S. growth with a correspondingly reduced emphasis on monetary policy.
The new policy making environment should cheer the Federal Reserve which has long argued for a more balanced approach.
Already, financial markets are re-pricing the inflation risk, raising the possibility that the multi-decade long bull market in government bonds could have already ended.
The accompanying chart repeated from last week’s commentary shows the tendency for the capital spending contribution to US GDP to decline in the near term as well as trend lower historically.
The change in the investment contribution goes to the heart of an assessment of the Trump administration’s economic impact - and how it might affect the resources industry.
Can the new administration effect a turn in the investment contribution to GDP? That seems unlikely without a willingness to expand the U.S. government deficit. Trump might be willing to do so himself but fiscal conservatives in Congress are likely to prove more reluctant.
The growth impact of the higher spending on infrastructure to which the Congress eventually commits might not be enough to make a noticeable difference.
While elements of
 the
Trump and Republican agendas are good for equity markets and growth, Trump’s
declarations about international trade remain a source of tension with the
mainstream economics profession.
the
Trump and Republican agendas are good for equity markets and growth, Trump’s
declarations about international trade remain a source of tension with the
mainstream economics profession.
The latter tend to believe, with some evidence, that any trade is good. Trump’s attitude is far more circumspect even to the extent of raising the spectre of an upsurge in global trade rivalries comparable to those that exacerbated the Great Depression.
The Canadian and Mexican governments seem open to reconsidering parts of NAFTA. The Trans Pacific Partnership trade agreement appears doomed, at least in its present form. Other potential trade agreements seem likely to take longer to negotiate with the new U.S. government likely to seek more favourable concessions for access to its markets.
Attention is turning to who occupies key executive roles in the new administration as a guide to future policy directions. So far, Trump has shown his own ambivalence about outcomes with the appointment of his two principal White House aides who come from different wings of the conservative movement.
Whether President Trump can do anything to spur growth globally is doubtful. He may not even be inclined to try.
A stronger growth outlook will remain the most important factor in sustaining the recent changes in commodity market conditions.
The anticipated changes in U.S. economic policy will be beneficial but probably too little and too slow to think of them having an important impact within 12-18 months.
Meanwhile, among other key indicators for the resources sector, a potentially stronger U.S. dollar, as bond yields rise, will pose a threat to U.S. dollar denominated commodity prices.
At the same time, elevated U.S. bond yields will make development finance more costly and depress asset values.
The fall in U.S. government bond prices will take strength from gold prices. Australian gold producers might face some additional uncertainties. Stronger coal and iron ore prices and more general optimism about inflation and the outlook for commodity prices could place more upward pressure on the Australian dollar while gold prices are falling.
Operators of currently high margin gold projects extrapolating past results may have to reappraise the economics of their businesses in some instances.