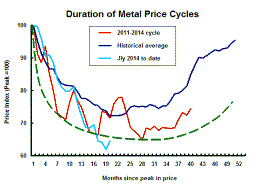
The Current View
Growth in demand for raw materials peaked in late 2010. Since then, supply growth has continued to outstrip demand leading to inventory rebuilding or spare production capacity. With the risk of shortages greatly reduced, prices have lost their risk premia and are tending toward marginal production costs to rebalance markets.
To move to the next phase of the cycle, an acceleration in global output growth will be required to boost raw material demand by enough to stabilise metal inventories or utilise excess capacity.
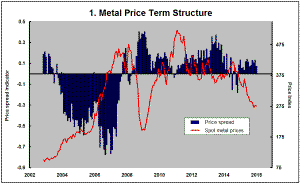
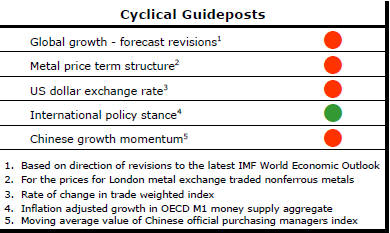
The PortfolioDirect cyclical
guideposts suggest that the best possible macroeconomic circumstances for
the resources sector will involve a sequence of upward revisions to
global growth forecasts, the term structure of metal prices once again
reflecting rising near term shortages, a weakening US dollar, strong money
supply growth rates and positive Chinese growth momentum. Only one of
the five guideposts is "set to green" suggesting the sector remains confined
to the bottom of the cycle .
Has Anything Changed?
Throughout 2014, PortfolioDirect had been characterising the cyclical position as ’Trough Entry’ with some expectation that by the end of 2014 an exit would be evident. Until very late in the year, the evidence supported that possibility before conditions took several backward steps.
The absence of a growth acceleration among the major economic regions is contributing to the flagging momentum. A stronger US dollar is also imparting a downward bias to US dollar denominated prices presently.
This change has been enough to define a fresh cycle and a more prolonged adjustment process.
Economy versus Markets
The severity of recent equity market losses has appeared to go much further
than economic conditions on their own might appear to warrant. Investors
have been prepared to raise the bet on a global recession.
For some, whatever the data may show, the stock market is a leading indicator of where the real economy is heading. Capital spending and consumer decisions will be delayed by the daily reporting of financial market volatility or weakness. Overall lower growth rates make it easier for the global economy to lurch suddenly into recession.
A US sales and earnings recession began over the year to
December. S&P 500 company sales declined 2.4% and operating
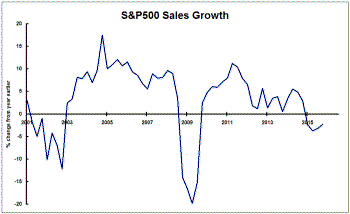 earnings
among the 84% of companies reporting so far have been 2.1% lower but 11.5%
down on their peak in the September quarter of 2014. Cutting back on costs
is no longer sufficient to avert earnings falls resulting from sluggish
revenue growth. Sales declines flowing to the bottom line are adding to the
downward pressures on equity prices.
earnings
among the 84% of companies reporting so far have been 2.1% lower but 11.5%
down on their peak in the September quarter of 2014. Cutting back on costs
is no longer sufficient to avert earnings falls resulting from sluggish
revenue growth. Sales declines flowing to the bottom line are adding to the
downward pressures on equity prices.
Evidence is growing of a disconnect between Federal Reserve policymakers, on the one hand, and businesses and others engaged in financial markets. Financial market analysts have been reducing the number of interest rate rises expected in 2016 while Fed members have continued to assume four increases.
This could change. The Federal Reserve has remained insistent that its decisions are data dependent rather than set on a preconditioned path leaving open the possibility of a prolonged pause in the interest rate normalisation process. While a change in the momentum of rate rises from that advertised by the Fed would probably be sensible, it would also add to market volatility as traders resume trying to second guess when the Fed will increase and by how much.
Yen Goes in Wrong Direction
The push by the Bank of Japan into negative interest rates was designed to
foster a lower yen in international currency markets. Since th e
rate cut initiative on at the end of January, however, the Japanese currency
has risen. The seemingly perverse reaction emphasises the uncertain
connections between monetary policy and other economic variables and the
extent to which policymakers (and investors) must look several steps ahead
to take account of the reactions of those affected by policy measures.
e
rate cut initiative on at the end of January, however, the Japanese currency
has risen. The seemingly perverse reaction emphasises the uncertain
connections between monetary policy and other economic variables and the
extent to which policymakers (and investors) must look several steps ahead
to take account of the reactions of those affected by policy measures.
The apparent need for additional policy measures has created further demand for financial safe havens of which Japan is one. Near term expectations, too, that the steps taken by the Bank of Japan will work in pushing growth higher have also encouraged some tendency to buy the yen in anticipation of that happening.
Resources is New Leader
The strongest global equity market segment so far in February
has been basic materials, according to the Dow Jones global equity price
sectoral indices. In the very near term, returns among some of the most
economically sensitive sectors have been converging. In January, the
financial and basic materials indices both declined 9.4% after dropping by
11.8% and 15.2%, respectively, over the past three months.
Over the past three years, basic
materials equity prices declined 37.1% while financials have dipped 2.1%.
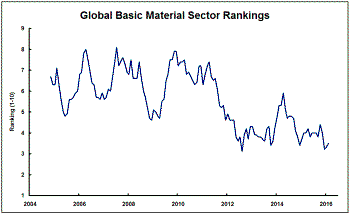
The chart shows the ranking enjoyed by the basic materials market sector within the 10 global industry indices calculated by S&P Dow Jones where a ranking of 1 means the worst performing sector of the 10. Over the past three years, monthly returns within the basic materials segment had an average ranking of four out of ten.
The performance of financials and basic materials is especially important in Australia because of their respective heavy weightings in the local market. Both sectors are now levered to the pessimistic growth outlook.
Financial sector profitability is geared to interest rate movements, particularly changes in the yield spread. The push to negative or very low interest rate policies with ebbing inflation putting a lid on bond yields is resulting in a flattened yield curve.
Basic materials companies depend on global growth for their underlying momentum. Downgraded global growth expectations are preventing any significant recovery in the prices of basic materials companies despite the already lengthy duration of the cyclical re-pricing they have undergone.
There is not much comfort in knowing that times are tough for everyone. There may be a modicum of good news for the miners, however, in knowing that the competitive advantage financial sector stocks might have been enjoying for several years is being lost because of the tie to the same global conditions.