The Current View
Growth in demand for raw materials peaked in late 2010. Since then, supply growth has continued to outstrip demand leading to inventory rebuilding or spare production capacity. With the risk of shortages greatly reduced, prices have lost their risk premia and are tending toward marginal production costs to rebalance markets.
To move to the next phase of the cycle, an acceleration in global output growth will be required to boost raw material demand by enough to stabilise metal inventories or utilise excess capacity.
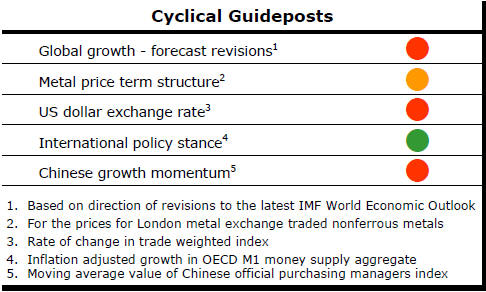
The PortfolioDirect cyclical
guideposts suggest that the best possible macroeconomic circumstances for
the resources sector will involve a sequence of upward revisions to
global growth forecasts, the term structure of metal prices once again
reflecting rising near term shortages, a weakening US dollar, strong money
supply growth rates and positive Chinese growth momentum. Only one of
the five guideposts is "set to green" suggesting the sector remains confined
to the bottom of the cycle .
Has Anything Changed? - Updated View
Since mid 2014, the metal market cyclical position has been characterised as ‘Trough Entry’ as prices have remained in downtrend with all but one of the PortfolioDirect cyclical guideposts - the international policy stance - flashing ‘red’ to indicate the absence of support.
The absence of a global growth acceleration, a stronger dollar and flagging Chinese growth momentum remain critical features of the current cyclical positioning.
Through February 2016, the first signs of cyclical improvement in nearly two years started to emerge. After 15 months of contango, the metal price term structure shifted to backwardation reflecting some moderate tightening in market conditions.
The metal price term structure is the most sensitive of the five cyclical guideposts to short term conditions and could, consequently, quickly reverse direction. Nonetheless, this is an improvement in market conditions and the guidepost indicator has been upgraded to ‘amber’ pending confirmation of further movement in this direction.
Exchange Rates Dominate Cyclical Positioning
The cyclical positioning of metal prices is displaying some recent
slippage. Although prices show signs of nearing the bottom of the cycle,
they are well below average for the equivalent point historically.
In the absence of meaningful change in global growth
momentum, the principal impetus for commodity prices is coming from currency
movements.
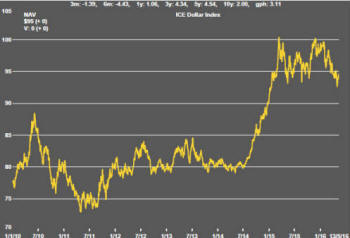
The chart shows the U.S. dollar index since 2010. The dramatic upward movement which commenced in mid 2014 coincides exactly with a down leg in U.S. dollar denominated commodity prices.
The exchange rate decline dating from early 2016 coincides with what some are now erroneously calling a recovery in commodity prices.
The recent change in the exchange rate direction coincides with a reappraisal of the extent to which U.S. interest rates are likely to rise in 2016.
The exchange rate action has taken us back to levels previously reached several times in the past two years after which, on each occasion, the move has been reversed. From a resource sector standpoint, the foreign exchange market can be described as precariously poised.
The next movement will probably be the result of a complex set of interactions among national monetary policies which currently favour an upward movement in the U.S. dollar leaving the prospect of higher commodity prices on shaky ground. .
Too Many Gaps in Gold Market Data
World Gold Council (WGC) data for the March quarter begs important
analytical questions about why gold prices rise.
The WGC has reported that “gold demand grew 21% to 1,289.8t” in the first quarter of 2016. The gold price appreciated by 17% “on the strength of investor conviction”, according to the gold industry mouthpiece as it reported breathlessly that “the enthusiasm with which investors renewed their appetite for gold ETFs in Q1 was palpable”.
One needs to understand the contrived nature of the council’s reporting framework to avoid drawing a hopelessly inaccurate conclusion from its commentary.
The stock of gold held did not increase by 21%. Nor was the amount of new gold acquired in the March quarter 21% higher than the amount taken up a year earlier. Either of these may have been understandable inferences from similar statements by more credible industry associations.
The WGC can misleadingly assert such a large increase because there are gaps in its reporting. It consistently fails to identify the sources of gold being purchased by the investors on which it keeps closest tabs.
In this instance, the statistics published by the council show that the amount of gold purchased by exchange traded funds in the March quarter increased more than tenfold to 338.1 tonnes.
The council weaves a storyline around “swirling uncertainty” to justify a supposed increase in demand by investors concerned about a loss of confidence in traditional asset classes. Their flight to safety, on this reasoning, propelled prices higher.
The only source of new gold over the past year, as always, is from mine supplies. They were 56.3 tonnes higher in the quarter than in the previous corresponding period.
Without any other feasible source of new gold, the WGC statistics imply that the bulk of the gold newly acquired by exchange traded funds must have come from sources liquidating previously held positions or transferring gold from alternative investment structures.
The March quarter outcome may just as validly warrant a headline along the lines of “slump in demand for gold”. Unless the WGC can identify the source of the gold being taken up by the ETFs, its statistics are going to be of little value to an investor seeking to interpret what may be happening.
There is also a flaw in the way the WGC tries to assess the price impact of the physical gold movements it is describing. The WGC compares physical movements in the first quarter of 2016 with the equivalent changes in the first quarter of 2015. In contrast, it compares the gold price in the first quarter of 2016 with the price at the end of the December quarter of 2015.
The average London gold price of US$1,182.6/oz in the most recent quarter compares with a price of US$1,218.5 a year earlier. The allegedly one fifth increase in demand appears to have coincided with a lower price than had prevailed when market conditions were less favourable.
In contrast to the first quarter of this year, the WGC has estimated that ETF holdings of physical gold had fallen by 312 tonnes during 2014 and 2015. Over a period of two years, the actual net change has been modest.
The WGC seems unable to account for either the source of the ETF gold accumulation this year or the destination of gold resulting from ETF liquidation in the prior two years.
Controversy abounds among gold market analysts about the accuracy of bullion market data. Some have argued cogently that the amount of freely tradeable gold has been sharply reduced through unreported or surreptitious transactions resulting in gold shifting into the vaults of the Chinese government, for example.
Any material rundown in the amount of gold available to investors trading in response to changes in macroeconomic conditions, such as would occur if gold is being secreted by unidentified buyers, would make gold prices increasingly sensitive to relatively small changes in macro conditions.
The WGC statistics, by leaving so may gaps, are not helpful in resolving a mystery critical to an understanding of the state of the gold market.
The WGC pretends gold is a commodity like copper or coal and dresses up its analysis accordingly. However, the typical commodity market balance analysis is focussed on what happens to current year production. Inferences are drawn about prices from an assessment of the market balances.
The WGC analysis, on the other hand, confusingly mixes current production and transactions arising from the historical stock of metal even when those latter transactions do not involve any net change in the stock on hand.
Meanwhile, a large body of investors thinks of gold as a monetary instrument or currency. For them, physical movements are less important than changes in financial market relative prices.
The gold price change in the March quarter coincided with a reappraisal of the extent to which the US Federal Reserve would normalise interest rates during 2016. Connected to that, a fall in the US dollar took the exchange rate to its lowest level in over two years.
These financial price changes would have warranted an increase in US dollar denominated gold prices. No doubt the upward move was reinforced by the attraction to traders of a rising price but the end result was a gold price that remained within the range it had occupied for the best part of three years.
Whether gold prices rise in response to more aggressive buying or whether buying is a reaction to rising prices and the expectation of a positive investment return remains unclear.