The Current View
Growth in demand for raw materials peaked in late 2010. Since then, supply growth has continued to outstrip demand leading to inventory rebuilding or spare production capacity. With the risk of shortages greatly reduced, prices have lost their risk premia and are tending toward marginal production costs to rebalance markets.
To move to the next phase of the cycle, an acceleration in global output growth will be required to boost raw material demand by enough to stabilise metal inventories or utilise excess capacity.
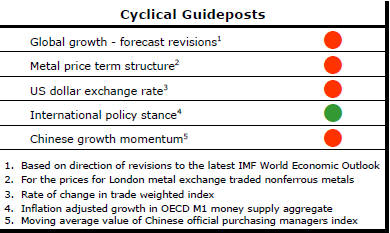
The PortfolioDirect cyclical
guideposts suggest that the best possible macroeconomic circumstances for
the resources sector will involve a sequence of upward revisions to
global growth forecasts, the term structure of metal prices once again
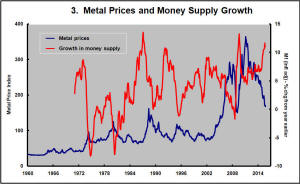
reflecting rising near term shortages, a weakening US dollar, strong money
supply growth rates and positive Chinese growth momentum. Only one of
the five guideposts is "set to green" suggesting the sector remains confined
to the bottom of the cycle .
Has Anything Changed?
Throughout 2014, PortfolioDirect had been characterising the cyclical position as ’Trough Entry’ with some expectation that by the end of 2014 an exit would be evident. Until very late in the year, the evidence supported that possibility before conditions took several backward steps.
The absence of a growth acceleration among the major economic regions is contributing to the flagging momentum. A stronger US dollar is also imparting a downward bias to US dollar denominated prices presently.
This change has been enough to define a fresh cycle and a more prolonged adjustment process.
Exchange Rate Driven Cycle
Industrial metal prices remained on a downtrend with a stronger U.S. dollar
and weaker global growth momentum contributing to the downward pressure.
It is timely to highlight once again the strongly
inverse correlation between movements in the U.S. dollar and changes in U.S.
dollar denominated metal prices. The chart uses the trade weighted index of
exchange rates with the major trading partners of the USA as a proxy for the
former and the International Monetary Fund metal price index for the latter.
For 35 years, a cyclical rise in metal prices has coincided with a declining exchange rate. There are no periods of any significant length in which a rising exchange rate has coincided with rising metal prices.
Most of the emphasis for metal price forecasters, including company executives commenting on the future direction of prices, is on changing physical market balances. The exchange rate is an added complication that cannot be ignored.
Exchange rate movements will offer some financial cushioning for metal producers outside the USA when markets are relatively weak. Generally, however, exchange rate movements will not be sufficient to compensate for declines in metal prices.
Exchange rate movements will have implications for the competitiveness of companies in different locations. Companies in some locations will be more favourably positioned than others to the extent a relatively high proportion of their costs are denominated in a relatively weak currency.
Uranium’s Biggest Producer Gets Price Rise
The Kazakhstan tenge exchange rate (303 to the US dollar) continues to move
lower as the country’s central bank has allowed it to float. This would
normally be of little consequence for anyone outside Kazakhstan but for the
fact the country accounts for 41% of the world’s uranium production (2014).
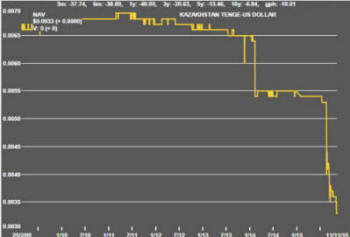
For the Kazakhstan uranium industry, the price has effectively risen 72% over the past year and 109% over two years while the US dollar price of the energy feedstock has remained near a long term cyclical trough.
There are numerous forces at work restraining global uranium prices but markets are strangely quiet about the impact of these currency moves. Historically, there have been outcries over exchange rate devaluations by major metal producers such as those in Africa and Latin America which have been perceived as taking unfair advantage from favourable currency outcomes and, in doing so, preventing markets from re-balancing as quickly as they otherwise could.