The Current View
Growth in demand for raw materials peaked in late 2010. Since then, supply growth has continued to outstrip demand leading to inventory rebuilding or spare production capacity. With the risk of shortages greatly reduced, prices have lost their risk premia and are tending toward marginal production costs to rebalance markets.
To move to the next phase of the cycle, an acceleration in global output growth will be required to boost raw material demand by enough to stabilise metal inventories or utilise excess capacity.
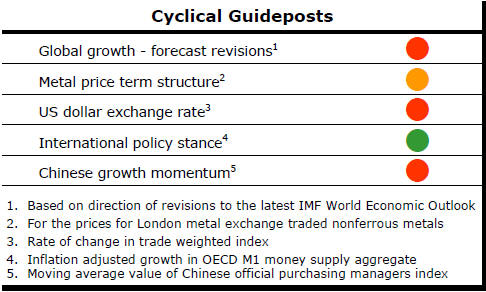
The PortfolioDirect cyclical
guideposts suggest that the best possible macroeconomic circumstances for
the resources sector will involve a sequence of upward revisions to
global growth forecasts, the term structure of metal prices once again
reflecting rising near term shortages, a weakening US dollar, strong money
supply growth rates and positive Chinese growth momentum. Only one of
the five guideposts is "set to green" suggesting the sector remains confined
to the bottom of the cycle .
Has Anything Changed? - Updated View
Since mid 2014, the metal market cyclical position has been characterised as ‘Trough Entry’ as prices have remained in downtrend with all but one of the PortfolioDirect cyclical guideposts - the international policy stance - flashing ‘red’ to indicate the absence of support.
The absence of a global growth acceleration, a stronger dollar and flagging Chinese growth momentum remain critical features of the current cyclical positioning.
Through February 2016, the first signs of cyclical improvement in nearly two years started to emerge. After 15 months of contango, the metal price term structure shifted to backwardation reflecting some moderate tightening in market conditions.
The metal price term structure is the most sensitive of the five cyclical guideposts to short term conditions and could, consequently, quickly reverse direction. Nonetheless, this is an improvement in market conditions and the guidepost indicator has been upgraded to ‘amber’ pending confirmation of further movement in this direction.
Looming US Recession-like Conditions Warrant
Interest Rate Caution
The recent path of US industry capacity utilisation summarises a
great deal about the state of the US economy and background financial market
conditions.
Whenever capacity utilisation has been at the level
recorded in March over the past 50 years, the US economy has suffered a
recession. The current capacity utilisation rate implies already
significant and growing excess capacity. 
It offers a partial explanation for the absence of wage cost pressures. It suggests inflation is unlikely to trouble policymakers. The falling capacity utilisation rate coincides with the rise in the US dollar and a leg down in commodity prices beginning in July 2014. Low utilisation rates reflect a resulting loss of US industry competitiveness. A consequential corporate earnings decline has contributed to the headwinds experienced by equity markets.
At any other time in history, if capacity utilisation had been at its recently recorded level, there would have been pressure on the Federal Reserve to reduce interest rates.
Other than the strong desire to ‘normalize’ rates to allow future policy flexibility, the argument to tighten policy presently seems dangerously flimsy.
Can Private Equity Speed Up the Cycle?
Private equity has been viewed as one way to help the mining industry out of
its cyclical funding morass and speed up the stalled development of mining
projects.
The impending volume of funds sounds impressive. Ten or twelve billion dollars are often said to be earmarked specifically for the mining industry. Several tens of billions of dollars are thought to be on offer from more general investors with the discretion to buy natural resources assets if sufficiently attractive projects are found.
Miners in the Kalgoorlie region of Western Australia tell stories of an influx of private equity investors all boasting bulging wallets and attracted to the cash flows coming from a newly resurgent gold industry backed by a weaker Australian dollar.
Few, if any, deals appear to have been done on the back of this tyre kicking. Private equity investors appear to have had an unrealistic view of what the mining industry generally offers.
Private equity fund managers are pretty clear in their own minds about what would trigger a positive investment decision. They want projects near production with potentially strong cash flows based on low cost structures and proven management. The term ‘tier one asset’ is bandied around as a generalised description of what would attract their funding.
Tier one assets, widely and correctly thought of as company making mines, remain only marginally more common than hens’ teeth.
In recent times, Oyu Tolgoi in Mongolia probably qualifies. Olympic Dam makes the grade with room to spare. Chile’s Escondida is there. Red Dog in Alaska is tier one, also. But they are the exceptions to a far more mundane flow of discoveries.
Oyu Tolgoi, now described by Rio Tinto as “one of the most exciting developments in copper and gold mining for several decades”, was discovered 15 years ago. BHP Billiton had given up looking after several years of concerted exploration following earlier investigations going back to the 1980s. Escondida was found over 35 years ago by a subsidiary of General Electric and Getty Oil in an earlier cycle of exploration and industry enthusiasm. South Australia’s polymetallic Olympic Dam mine was opened in 1988 but well after Western Mining teamed up with BP in 1979 to get the mine going.
Red Dog dates from 1968 when the first mineralisation was reported. In 1980, Cominco’s exploration commitment underwrote the search. Then a subsidiary of conglomerate Canadian Pacific, Cominco was following the path of a dozen other large north American mining houses recognising what had to be done to sustain their business models even in the depth of an industry recession.
The history of tier one mines shows two things: their infrequency and the important roles of large corporate balance sheets in the discovery and development process. Without the likes of General Electric, BP, Canadian Pacific and large mining houses, mostly no longer present, many of the world’s most productive mines will have struggled to see the light of day.
As exploration spending declines and large balance sheets disappear from the industry, the company-making discovery seems increasingly elusive. Smaller companies may seek to fill the discovery gap but their stretched financial capacity prolongs likely discovery times even for the most successful.
Ironically, for those with private equity funds to invest, tier one mines have also been among the most easily financed properties in the industry with banks and institutional equity investors usually ready to participate.
Capital from these traditional funders of large mining developments is likely to also remain cheaper for a range of second tier assets than capital from any other source. In reality, private equity may have little role to play in bringing the highest quality properties to life. Their potential lies further down the quality pecking order.
Private equity money may, under some circumstances, substitute for the catalysing role of corporates through the provision of finance but the gatekeepers for these funds appear unwilling to fund the critical discovery process. Nor, a few exceptions aside, are they able to contribute much in the way of technical expertise to drive the often complex, time consuming and costly work between discovery and a development commitment.
Today’s private equity investors are seeking to ride on the backs of the exploration and analytical efforts of others.
The private equity approach to the mining industry is an understandable neophyte tactic but one doomed to eventual failure. Exploration is becoming tougher. Most likely, deeper and more expensive exploration programs will be needed to pursue the next generation of meaningful mineral discoveries.
Unfortunately, an increasingly heavy reliance on individual investors to shore up exploration efforts leaves a dark cloud over exploration funding. Without the private investors who have been the backbone of the most recent global exploration efforts, the long term outlook for private equity as a meaningful contributor to industry growth can also be dismissed.
Unwillingness to fund exploration reduces the chance of ever finding projects with the investment characteristics private equity typically seeks. The increasing lead time between initiating exploration and having a producing mine will also limit involvement of private equity funds.
Against this background, private equity funds will be at risk of their investors withdrawing capital. To avert that possibility, funds will have to modify their shopping lists. A preparedness to accept higher risk will become necessary.
Without such an adjustment in approach, private equity investors can be treated by the mining industry as mostly talk unmatched with action.
So, the question to be addressed to private equity fund managers by the mining industry is not how much they have to invest but whether they have come to terms with reality. In short, if they want to participate, are they prepared to pay their way? .