The Current View
Growth in demand for raw materials peaked in late 2010. Since then, supply growth has continued to outstrip demand leading to inventory rebuilding or spare production capacity. With the risk of shortages greatly reduced, prices have lost their risk premia and are tending toward marginal production costs to rebalance markets.
To move to the next phase of the cycle, an acceleration in global output growth will be required to boost raw material demand by enough to stabilise metal inventories or utilise excess capacity.
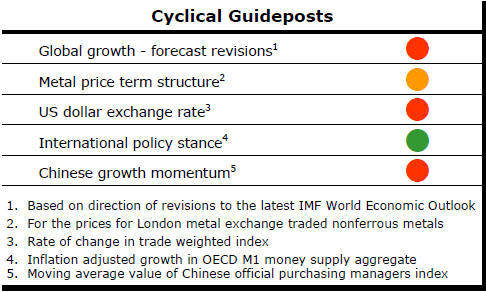
The PortfolioDirect cyclical
guideposts suggest that the best possible macroeconomic circumstances for
the resources sector will involve a sequence of upward revisions to
global growth forecasts, the term structure of metal prices once again
reflecting rising near term shortages, a weakening US dollar, strong money
supply growth rates and positive Chinese growth momentum. Only one of
the five guideposts is "set to green" suggesting the sector remains confined
to the bottom of the cycle .
Has Anything Changed? - Updated View
Since mid 2014, the metal market cyclical position has been characterised as ‘Trough Entry’ as prices have remained in downtrend with all but one of the PortfolioDirect cyclical guideposts - the international policy stance - flashing ‘red’ to indicate the absence of support.
The absence of a global growth acceleration, a stronger dollar and flagging Chinese growth momentum remain critical features of the current cyclical positioning.
Through February 2016, the first signs of cyclical improvement in nearly two years started to emerge. After 15 months of contango, the metal price term structure shifted to backwardation reflecting some moderate tightening in market conditions.
The metal price term structure is the most sensitive of the five cyclical guideposts to short term conditions and could, consequently, quickly reverse direction. Nonetheless, this is an improvement in market conditions and the guidepost indicator has been upgraded to ‘amber’ pending confirmation of further movement in this direction.
Improved Cyclical Positioning
The cyclical positioning of metal prices appears to have improved further.
Since the beginning of 2016, the PortfolioDirect index used
to depict the metal price positioning (shown in light blue in the
accompanying duration of metal price cycles chart) has risen by 15%.
Despite the magnitude of the rise giving way to a clear improvement in market conditions, the cyclical positioning can still be characterised as below average for this far into the cycle.
The markets are at a point which will permit some reinterpretation of conditions in coming weeks.
The evidence will more clearly show whether the price momentum is sufficient to allow the cycle to be described, for the first time, as “above average” or whether prices will lose their momentum and revert to the sub-standard performance of the past two years.
US Manufacturing Recession
Recession-like conditions have prevailed within the U.S. manufacturing
sector for most of the past year. In the 18 months since the beginning of
2015, U.S. industrial production has expanded in only five months, according
to the U.S. Federal Reserve monthly report on industrial production. The
reported output expansion of 0.6% in June 2016 was the third in 10 months
leaving the contraction from a year ago at 0.7%, the smallest over the year
decline since October 2015. 
The industrial production statistics feed into earnings estimates, national growth statistics and assessments of raw material markets.
The output results from the past year emphasise the extent to which the U.S. national economic performance has depended on individual consumers to spend.
The more positive inference from the numbers is that the momentum is turning. As shown in the PortfolioDirect report last week, manufacturers have begun to see growth in new export orders.
A more positive commodity market tone may also be attributable partly to some improvement in underlying demand from U.S. manufacturers.
Comments from company management as they report on their June quarter earnings may provide some further guidance about the longevity of some of these nascent trends.
Gold Equity Leverage to Contract
Conventional wisdom suggests that gold-related equities offer greater
leverage to conditions favouring higher gold bullion prices.
Whether there is evidence for that belief depends on the
specific period chosen from which to select the data. The shorter and more
selective the timeframe the more support for the proposition.

Over the longer haul, such as the period covered by the chart, the positive leverage effect is not present.
Leverage works in both directions. Downside leverage has typically exceeded the upside responsiveness of equity prices to changes in bullion prices. Equity prices have fallen in response to lower bullion prices by so much that catching up subsequently has proven too difficult.
Mine exhaustion is another important effect over the long haul. Mines tend to contain less gold with the passage of time or, even when resources are maintained, extraction costs escalate leading to less attractive valuations.
The ounce of gold bought 20 years ago remains intact indefinitely. The equivalent value in gold equities is generally worth far less 20 years later for these reasons.
Over the past several months, gold equities have benefited from the leverage which comes with cyclically weak prices as conditions turn.
The leverage of gold equity prices to changes in bullion prices has been unusually strong so far in 2016.
 The
chart, based on monthly movements in prices, shows the response of the
Philadelphia Gold and Silver stock index to movements in gold bullion prices
over the past 20 years. The blue markers reflect the data to the end of
2015. The red markers illustrate the experience over the first seven months
of 2016.
The
chart, based on monthly movements in prices, shows the response of the
Philadelphia Gold and Silver stock index to movements in gold bullion prices
over the past 20 years. The blue markers reflect the data to the end of
2015. The red markers illustrate the experience over the first seven months
of 2016.
Prior to 2016, a 5% increase in the gold price generated an average rise in equity prices of 7.5%, although the leverage in weakening markets was stronger. A 5% bullion price decline was associated with a 9.1% fall in equity prices.
Over the most recent seven month period, a 5% increase in bullion prices has implied an average 19.4% equity price response.
The difference between the 2016 response and the responses in earlier years implies some reversion to the historical response rate is likely to occur once the leverage associated with the turn of the cycle has run its course.
Equity prices will most likely continue to rise in response to changes in bullion prices but the size of the reaction is set to halve, at least, as of the gold price cycle proceeds.