The Current View
Growth in demand for raw materials peaked in late 2010. Initially, supply growth had outstripped demand leading to inventory rebuilding or spare production capacity. With the risk of shortages greatly reduced, prices lost their risk premia and tended toward marginal production costs to rebalance markets.
The PortfolioDirect cyclical guideposts suggest that the best possible macroeconomic circumstances for the resources sector will involve a sequence of upward revisions to global growth forecasts, the term structure of metal prices once again reflecting rising near term shortages, a weakening US dollar, strong money supply growth rates and positive Chinese growth momentum.
Two of the five guideposts are "set to green" suggesting the most arduous part of the cyclical adjustment has passed. Although conditions have improved, the principal macroeconomic drivers do not yet appear to have sufficient momentum to carry the cycle into the upswing phase.

Has Anything Changed? - Updated View
From mid 2014, the metal market cyclical position was characterised as ‘Trough Entry’ with all but one of the PortfolioDirect cyclical guideposts - the international policy stance - flashing ‘red’ to indicate the absence of support.
Through February 2016, the first signs of cyclical improvement in nearly two years started to emerge. The metal price term structure reflected some moderate tightening in market conditions and the guidepost indicator was upgraded to ‘amber’ pending confirmation of further movement in this direction.
As of early December 2016, the Chinese growth momentum indicator was also upgraded to amber reflecting some slight improvement in the reading from the manufacturing sector purchasing managers index. Offsetting this benefit, to some extent, the policy stance indicator was been downgraded from green to amber.
At the end of July 2017, the exchange rate guidepost was upgraded to green.
As 2017 ended, there were emerging signs economic forecasters may have begun a sequence of growth forecast upgrades prompting a revision of the global growth guidepost to "green".
Cyclical Position
The level of metal prices is consistent with the historical average this far into a cycle.
Time, of itself, is not important but the sequence of adjustments which contribute to higher prices and changed expectations does take time.
The question now is whether there is enough momentum to carry the industry into the upswing phase of the cycle. More often than not, progress stalls at this point.
A pullback is not a necessary outcome but an alternative result would most likely require some combination of higher growth, further U.S. dollar weakness or a period of more supportive monetary policies.
Currency moves are proving the strongest support in the near term with growth having already risen and set to stabilise. Policy settings are changing gradually but are set to become progressively less supportive.
The balance of risks suggests a more moderate appreciation in metal prices.
Global Growth - Forecast Revisions
In January, the World Bank announced that it had raised its global GDP growth forecast for 2018 from 2.9% to 3.1%. The forecast for 2019 was raised from 2.9% to 3.0%.
On 22 January, the IMF again revised its forecasts for
2018 and 2019 - adding 0.2 percentage points to its earlier forecasts for
each year.
The upgrades to the global growth outlook by the two international organisations ostensibly contained some of the best news for the mining industry since 2010.
The strongest increases in metal usage typically occur when global GDP growth is accelerating. Rising growth projections are usually a prompt for strategists to raise sectoral fund allocations.
The not so good news is that 2017 is nearly as good as it gets, in the eyes of the Fund and the World Bank.
Much of the anticipated growth improvement in 2018 is due to the acceleration in growth which has already occurred through 2017.
The IMF annual forecasts imply growth of 3.9% between the fourth quarter of 2018 and the corresponding period a year earlier, the same as has already occurred over the year to the end of 2017. The forecast for growth over the year ended December 2019 is little different at just 3.8%.
 Among the advanced economies, according to the IMF October review, growth by 2022 is expected
to be 0.5 percentage points lower than in 2017 as economic slack is
eliminated.
Among the advanced economies, according to the IMF October review, growth by 2022 is expected
to be 0.5 percentage points lower than in 2017 as economic slack is
eliminated.
Chinese growth is expected to decline by a full percentage point.
Any global growth improvement is expected to come entirely from emerging market economies outside China in Latin America, the Middle East and sub-Saharan Africa.
The World Bank growth forecasts portray a similar picture of slightly stronger and lower risk growth in the immediate future but, after that, little difference in the coming three years than the average over the past eight years.
A larger allocation of funds to the resources sector would normally depend on upward revisions to this growth picture helping to improve investor sentiment. This is not out of the question but appears doubtful without sources of added momentum.
A stronger contribution from productivity is a necessary ingredient for stronger growth. Unusually low productivity growth in most advanced economies has reflected low business investment spending and governments with little enthusiasm for reform. Without changes on this front, the IMF outlook appears the most realistic future course for growth.
Legislation to cut taxes in the USA will add a fiscal stimulus in the near term but offers a chance of productivity enhancing capital spending in the next several years to sustain a stronger growth base.
US Dollar Exchange Rate - Chart 2
Along with reduced risks to growth, a weaker U.S. dollar has contributed to the upward trajectory in metal prices.
Over the past 45 years, a 1% fall in the US dollar trade weighted index has come with an average rise of 3% in nonferrous metal prices. Since the end of 2016, the US dollar has fallen against a basket of currencies by 11% while daily traded non ferrous metal prices have risen 22%.
The currency adjustment has reflected some reappraisal
of relative growth rates and the direction and pace of interest rate
changes.
In particular, a rethink occurred about the length of the lag between the U.S. Federal Reserve beginning to tighten its monetary policies and the European Central Bank going down the same path.
After that initial adjustment to changes in interest rate expectations, markets have also responded to an improved outlook for growth in Europe and the diminished risks to growth attaching to instability in its financial system
Another negative influence on the US dollar has been the reduced need in a less risky macro environment for use of the US dollar as a safe haven.
All these factors remain relevant but, once markets have taken them into account, a period of relative stability is likely to ensue pending another reason for reappraising the equilibrium level.
While stronger US growth from a tax driven fiscal stimulus may work in that direction, rising debt levels will push the currency in the direction of its longer term downward trajectory.
International Policy Stance - Chart 3
Global monetary policies had been set to support higher asset prices as a step toward raising demand and creating stronger employment markets.
While the emphasis on these policies is being reduced as growth becomes more self sustaining, monetary accommodation remains historically strong.
Metal prices are affected by monetary conditions with a lag of several quarters so that there is no imminent threat from future winding back in monetary support but the prospective trajectory of monetary policy will be a source of eventual downward pressure on metal prices.
As some of the most favourable monetary conditions in modern history are wound back, the mining industry will be relying more heavily on output growth and, for that, on the willingness of governments to foster stronger productivity outcomes to raise global growth potential.
Stronger productivity growth will facilitate increases in wages with fewer worries about rising inflation pressures.
Higher wages growth does not necessarily herald a need for less accommodating monetary policies if the supply side response is adequate or if competitive market conditions constrain price adjustments.
Many combinations of possible economic outcomes do not warrant any change in the gradualist approach to policy change outlined by the world's major central banks.
The greatest danger to a metal price cycle comes when monetary policy settings begin to tighten in response to higher inflation with an adverse effect on output growth and investment spending.
Metal Price Term Structure - Chart 1
Some tightening in nonferrous metal price spreads has been occurring over the past several months driven by emerging backwardations in London Metal Exchange lead and zinc prices.
The tightening in spreads is modest by the standards of what might be possible but overall physical market balances do not appear to be changing enough for the shift in premiums to move more dramatically.
The International Copper Study Group (ICSG) has reported that demand for the metal in the 11 months to November 2017 rose by 0.6% from the corresponding period of 2016 raising the possibility of the smallest annual increase in demand since 2009.
 The ICSG has estimated a slight
increase in global metal inventories between the end of November 2016 and the
end of November 2017.
The ICSG has estimated a slight
increase in global metal inventories between the end of November 2016 and the
end of November 2017.
The International Lead Zinc Study group has reported that zinc usage has increased at a 1.7% annual rate between 2010 and 2017 compared with a metal output growth rate of 1.0% leading to a multi-year rundown in inventories on a scale which has occurred only twice before in the past 50 years.
Constraints on the supply side have driven tighter market conditions but these can be reversed quite quickly. If the mine production rat in the last quarter of 2017 was maintained through 2018, output will have grown by nearly 9% in the current year.
With only moderately increasing rates of usage across the major daily traded metals, relatively narrow metal price spreads may indicate market conditions are insufficiently strong (and possibly subject to reversal if producers choose to do so) to carry the cycle significantly further.
Chinese Growth Momentum - Chart 4
Chinese manufacturing enjoyed a prolonged expansion
during 2017 which has helped build positive sentiment for investments in the
mining sector (as illustrated in the fourth chart in the right hand panel).
Current Chinese growth rates remain highly dependent on bank lending despite widespread agreement that the flow of funds is unsustainable and creating longer term distortions which will need addressing.
More accommodating policy settings than have been in place for the past several years are highly unlikely, biasing any cyclical risks for raw material markets to the downside.
The restructuring of the Chinese economy with the resulting contraction in the contribution to Chinese GDP of investment spending will have a generally detrimental effect on raw material demand.
 Chinese steel production in 2017 was higher than in 2016
but little different from four years earlier.
Chinese steel production in 2017 was higher than in 2016
but little different from four years earlier.
Other signs of subdued momentum have been evident in statistics released by the International Copper Study Group and the International Lead Zinc Study group which show global per capita metal usage rates remaining little changed for four consecutive years.
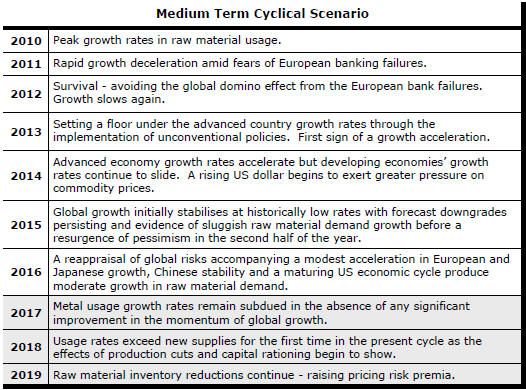
 The chart illustrates the cyclical classifications used to define the positioning of the metal markets. The
cyclical positioning informs recommendations about the allocation of funds within the sector.
The chart illustrates the cyclical classifications used to define the positioning of the metal markets. The
cyclical positioning informs recommendations about the allocation of funds within the sector.
