The Current View
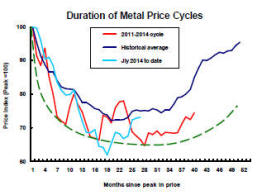
Growth in demand for raw materials peaked in late 2010. Since then, supply growth has continued to outstrip demand leading to inventory rebuilding or spare production capacity. With the risk of shortages greatly reduced, prices have lost their risk premia and are tending toward marginal production costs to rebalance markets.
To move to the next phase of the cycle, an acceleration in global output growth will be required to boost raw material demand by enough to stabilise metal inventories or utilise excess capacity.
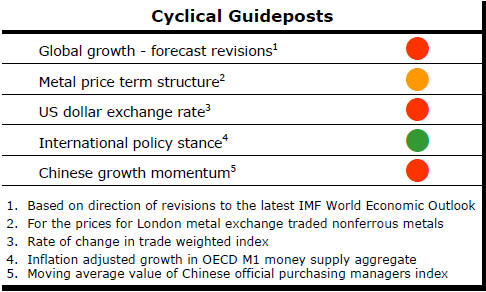
The PortfolioDirect cyclical
guideposts suggest that the best possible macroeconomic circumstances for
the resources sector will involve a sequence of upward revisions to
global growth forecasts, the term structure of metal prices once again
reflecting rising near term shortages, a weakening US dollar, strong money
supply growth rates and positive Chinese growth momentum. Only one of
the five guideposts is "set to green" suggesting the sector remains confined
to the bottom of the cycle .
Has Anything Changed? - Updated View
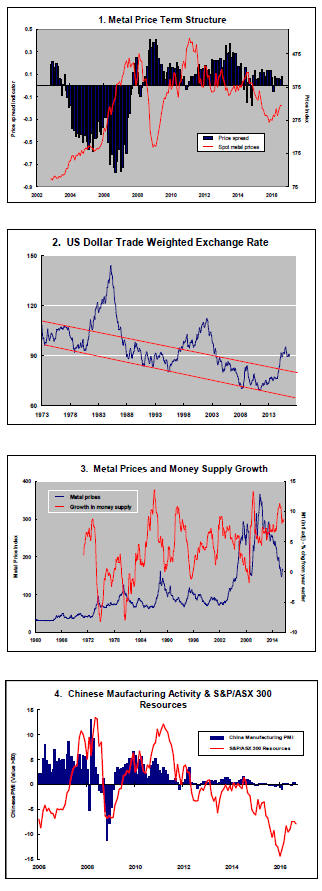
Since mid 2014, the metal market cyclical position has been characterised as ‘Trough Entry’ as prices have remained in downtrend with all but one of the PortfolioDirect cyclical guideposts - the international policy stance - flashing ‘red’ to indicate the absence of support.
The absence of a global growth acceleration, a stronger dollar and flagging Chinese growth momentum remain critical features of the current cyclical positioning.
Through February 2016, the first signs of cyclical improvement in nearly two years started to emerge. After 15 months of contango, the metal price term structure shifted to backwardation reflecting some moderate tightening in market conditions.
The metal price term structure is the most sensitive of the five cyclical guideposts to short term conditions and could, consequently, quickly reverse direction. Nonetheless, this is an improvement in market conditions and the guidepost indicator has been upgraded to ‘amber’ pending confirmation of further movement in this direction.
Mining Industry Profits Stabilise
Mining industry profits showed some signs of stabilising during the first
half of 2016 with two consecutive quarterly rises in seasonally adjusted
pre-tax profits in the March and June quarters, according to the Australian
Bureau of Statistics. June quarter profits were 30% higher than in the
quarter ended December 2015.
The ABS reported that pre-tax sector profits in the June quarter were 33% lower than a year earlier. Profits of $16.98 billion in the 12 months ended June 2016 were 42% lower than over the corresponding period a year before.
Profits ended the quarter 80% lower than at their cyclical peak in the September quarter of 2011.
 The
rapid decline in profitability has forced an investment spending cut back
which has been widely documented as a consequence of its impact on the
growth of the Australian economy but the industry did spend another $56.5
billion over the 12 months to June 2016, according to the ABS national
accounts data – about half the rate of spending incurred at the peak of the
investment cycle in 2013.
The
rapid decline in profitability has forced an investment spending cut back
which has been widely documented as a consequence of its impact on the
growth of the Australian economy but the industry did spend another $56.5
billion over the 12 months to June 2016, according to the ABS national
accounts data – about half the rate of spending incurred at the peak of the
investment cycle in 2013.
Albeit reduced, ongoing historically high spending levels have posed an increasingly difficult challenge for those in the mining industry seeking to generate a suitable return on investment.
PortfolioDirect modelling suggests the industry is now falling short by around $70 billion a year in achieving an adequate return on capital invested.
While these economic losses may have to be treated as permanently unrecoverable, the shortfall is not inconsequential for the industry’s future. The experience will have made the industry more reluctant to pick up the pace of spending even beyond the point at which the need for new capacity will have been demonstrated.
US Debt Adjustment
The latest statistics from the U.S. Federal Reserve on the rebuilding of
U.S. private debt levels shows business readily embracing lower interest
rates but households - which account for two-thirds of U.S. GDP via their
consumption spending - in a less ebullient mood.
At the end of June 2016, non-financial business debt levels were 23.5% higher than at the end of December 2008.
Debt accumulation rates have returned to the pace prevalent prior to the onset of the 2008/09 financial crisis.
Household debt levels have also been restored but have only slightly edged above the level prevailing prior to the financial crisis. Household debt at the end of June was just 0.8% higher than at the end of September 2008.
One of the constraining influences on the willingness of households to assume a greater debt burden has been lack of confidence about real estate values which had underpinned much of the debt build-up in the prior cycle.
The value of household real estate had begun falling as early as 2006 - well before the conventional dating of the financial crisis.
The value of real estate assets at the end of June 2016 was still 5.4% lower than the previous highest value of real estate holdings despite having doubled since the end of June 2011 when the value of household real estate had hit its cyclical low.