The Current View
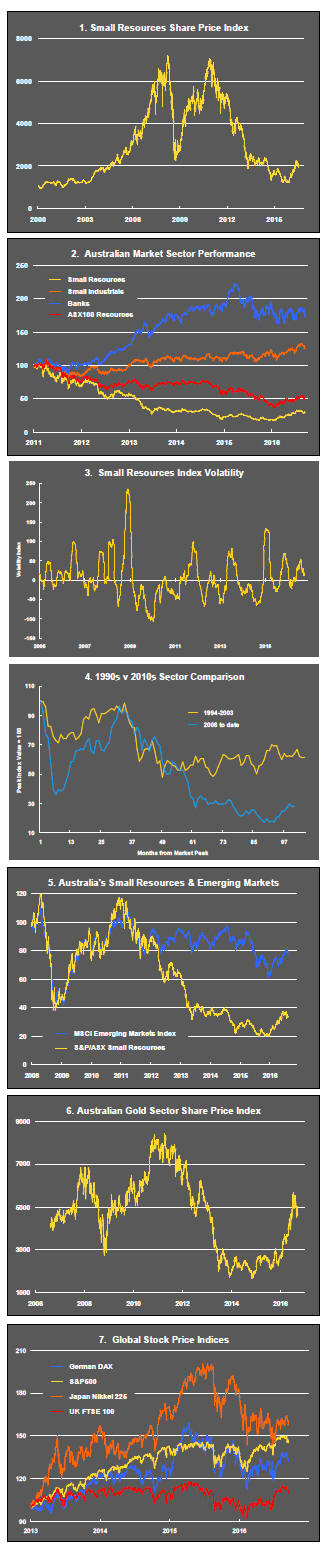
A lengthy downtrend in sector prices had given way to a relatively stable trajectory after mid 2013 similar to that experienced in the latter part of the 1990s and first few years of the 2000s.
The late 1990s and early 2000s was a period of macroeconomic upheaval during which time sector pricing nonetheless proved relatively stable. That remains a possible scenario for sector prices.
Relative stability suggests a chance for companies genuinely adding value through development success to see their share prices move higher. This was the experience in the late 1990s and early 2000s.
The lower equity prices fall - and the higher the cost of capital faced by development companies - the harder it becomes to justify project investments.
Has Anything Changed?
A 1990s scenario remains the closest historical parallel although the strength of the US dollar exchange rate since mid 2014 has added an unusual weight to US dollar prices.
The first signs of cyclical stabilisation in sector equity prices have started to show. This has meant some very strong ‘bottom of the cycle’ gains but only after prices have already fallen by 70% or more in many cases leaving prices still historically low.
Funding for project development may have passed its most difficult phase at the end of 2015 with signs of deals being done and evidence that capital is available for suitably structured transactions.
Key Outcomes in the Past Week
U.S. equity markets held the line during the week after a dramatic decline on the previous Friday even as oil prices retraced the previous gains.
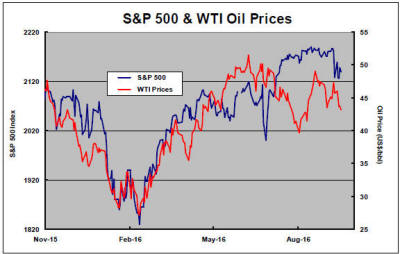
Once again, trying to anticipate what the Federal Reserve (and Bank of Japan and European Central Bank) will do next heavily influenced market outcomes. The relative stability of the past week hinted at a reluctance of traders to take a bet one way or another before the U.S. and Japanese central bankers meet again to consider policy.
Decisions by both institutions have the capacity to influence, and possibly destabilise, markets with few other drivers changing sufficiently to negate their impact and influence outcomes.
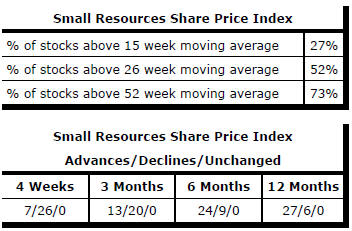
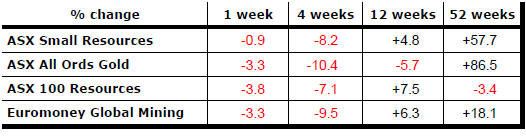
The resources sector performance statistics shown in the table above highlight the tendency for sector prices to have stalled.
At the large market capitalisation end of the market in Australia, all the gains from the past year have been given up.
Gold, which had dominated the sector return profile in the past year, is now leading the way down. Only three out of 20 stocks in the All Ordinaries gold index have posted positive outcomes over the past four weeks. Within Australia’s small resources share price index, declining prices have outnumbered advances over four and 12 weeks.
The PortfolioDirect model outcomes are showing a similar picture. With the effect of macro driven money being felt initially by the larger stocks, the Phase I end of the market has tended to perform better.
These conditions have also meant that Phase I and Phase II companies have found it hard to sustain share price rises when they have arisen. The downside risks within the Phase I part of the market have also been limited by the large numbers of Phase I companies still trading near the low end of historical price ranges.
Profit Share to Retard Market Upside
Australia’s corporate profit share has reverted to the upper end of a range
which had prevailed for five decades prior to 2007 during which time it had
been an especially compelling guidepost for medium term investors.
The blue line in the chart showing private non-financial corporate operating surplus as a share of non-farm product is a macro indicator of business profit margins. The yellow line depicts the inflation adjusted All Ordinaries share price index.
The resources sector profit collapse is the largest element in the overall profit share decline but approximately one-third of the fall comes from non-resources parts of the economy.
The divergence between the two measures since 2008 reflects recovery from the 2008/09 share market collapse which, not having affected profitability immediately, warranted some adjustment. Unprecedentedly strong central bank liquidity flows may have also temporarily reduced market responsiveness to profit changes.
With the prospect of the pre-2007 relationship being reinstated, a positive view of future market directions now appears to depend on a presently unlikely record-breaking non-resources profit rebuild.
Market Breadth Statistics