The Current View
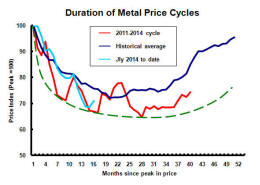
Growth in demand for raw materials peaked in late 2010. Since then, supply growth has continued to outstrip demand leading to inventory rebuilding or spare production capacity. With the risk of shortages greatly reduced, prices have lost their risk premia and are tending toward marginal production costs to rebalance markets.
To move to the next phase of the cycle, an acceleration in global output growth will be required to boost raw material demand by enough to stabilise metal inventories or utilise excess capacity.
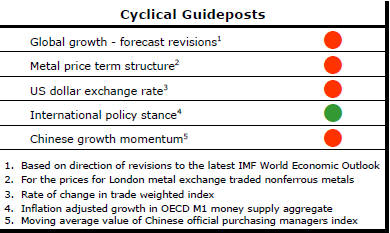
The PortfolioDirect cyclical
guideposts suggest that the best possible macroeconomic circumstances for
the resources sector will involve a sequence of upward revisions to
global growth forecasts, the term structure of metal prices once again
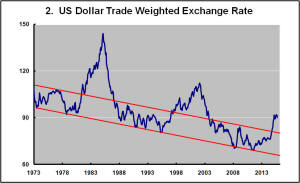
reflecting rising near term shortages, a weakening US dollar, strong money
supply growth rates and positive Chinese growth momentum. Only one of
the five guideposts is "set to green" suggesting the sector remains confined
to the bottom of the cycle .
Has Anything Changed?
Throughout 2014, PortfolioDirect had been characterising the cyclical position as ’Trough Entry’ with some expectation that by the end of 2014 an exit would be evident. Until very late in the year, the evidence supported that possibility before conditions took several backward steps.
The absence of a growth acceleration among the major economic regions is contributing to the flagging momentum. A stronger US dollar is also imparting a downward bias to US dollar denominated prices presently.
This change has been enough to define a fresh cycle and a more prolonged adjustment process.
Weaker Manufacturing Data Flags Market Drop
The US Institute for Supply Management monthly manufacturing conditions
index has been slipping lower. The September reading of 50.2 was the lowest
since May 2013 and closing in on the border between industry expansion and
contraction.
The index is consistent with other measures suggesting a
slowing in the rate of US economic activity. The trajectory of the index is
also consistent with a loss of stock market momentum.
The chart shows the deviations from a reading of 50 in the ISM index (in the blue bars) and the smoothed rate of change in the S&P 500 share price index (in the red line). The S&P 500 index has fallen 4.7% over the past 12 months. The smoothed 12 month stock returns are still positive but heading lower.
Manufacturing output is under some pressure from a strong currency and relatively modest growth in domestic demand associated with historically slow growth in wages. Weak international economic conditions are also constraining exports. A continuing emphasis on household debt reduction is limiting domestic demand growth.
A turn in the currency would assist the outlook for manufacturers and provide some stock market support. A delay in the Fed moving to raise interest rates is unlikely to support activity directly but may help indirectly to the extent it removes the upward bias to US dollar exchange rates.
US Import Prices in Recession Style Fall
U.S. import prices (excluding petroleum) were 3.3% lower in September than a
year earlier. The decline in prices is reminiscent of the outcomes which
have typified recession-like conditions in the past.
The most recent fall in prices has coincided with the rapid strengthening of the U.S. dollar since mid 2014. Weaker global demand conditions would also have contributed to some easing in the rate of price increase for manufactured goods.
The weaker rate of price increase will have an impact on domestic U.S. price inflation and, through that, on the pace at which the Federal Reserve will be prepared to raise interest rates. Although Federal Reserve board members have continually asserted their beliefs that inflation will rise toward their targeted 2%, actual outcomes have not offered compelling support or evidence.
The import price statistics are another indicator that the Federal Reserve can afford to delay a rate rise decision without jeopardising successful pursuit of its price stability mandate.
The U.S. dollar is less likely to appreciate further if interest rates do not rise in which case the downward pressure on prices will ease somewhat. The Federal Reserve and markets generally are having to contend with these feedback loops in coming to judgments about policy. The lack of a single line of causation leads to the sometimes conflicting interpretations confusing markets presently.
US Sentiment Supports Growth
The preliminary October U.S. consumer sentiment reading from the University
of Michigan rose to 92.1.
The 5.6% increase from the September final result suggests that pessimism about global conditions permeating financial markets has not extended to the broader population. Statistically at least, consumers appear relatively content about the state of the job market and containment of inflation. Consumer sentiment appears consistent with at least a modest ongoing rate of economic expansion.