The Current View
Growth in demand for raw materials peaked in late 2010. Since then, supply growth has continued to outstrip demand leading to inventory rebuilding or spare production capacity. With the risk of shortages greatly reduced, prices have lost their risk premia and are tending toward marginal production costs to rebalance markets.
To move to the next phase of the cycle, an acceleration in global output growth will be required to boost raw material demand by enough to stabilise metal inventories or utilise excess capacity.
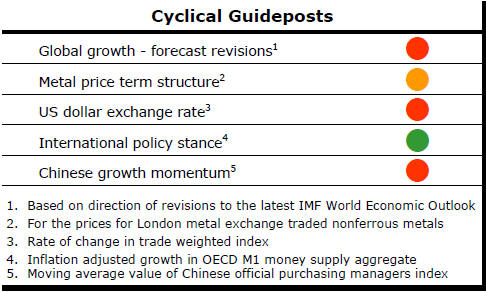
The PortfolioDirect cyclical
guideposts suggest that the best possible macroeconomic circumstances for
the resources sector will involve a sequence of upward revisions to
global growth forecasts, the term structure of metal prices once again
reflecting rising near term shortages, a weakening US dollar, strong money
supply growth rates and positive Chinese growth momentum. Only one of
the five guideposts is "set to green" suggesting the sector remains confined
to the bottom of the cycle .
Has Anything Changed? - Updated View
Since mid 2014, the metal market cyclical position has been characterised as ‘Trough Entry’ as prices have remained in downtrend with all but one of the PortfolioDirect cyclical guideposts - the international policy stance - flashing ‘red’ to indicate the absence of support.
The absence of a global growth acceleration, a stronger dollar and flagging Chinese growth momentum remain critical features of the current cyclical positioning.
Through February 2016, the first signs of cyclical improvement in nearly two years started to emerge. After 15 months of contango, the metal price term structure shifted to backwardation reflecting some moderate tightening in market conditions.
The metal price term structure is the most sensitive of the five cyclical guideposts to short term conditions and could, consequently, quickly reverse direction. Nonetheless, this is an improvement in market conditions and the guidepost indicator has been upgraded to ‘amber’ pending confirmation of further movement in this direction.
Leading Indicators Show Further Slowing
Metal prices are near their cyclically weakest point. There has been no new
data in the past week to modify that judgment. Near term price fluctuations
will continue to be heavily influenced by exchange rate movements in the
absence of any significant improvement in global growth momentum.
The importance of exchange rate movements translates into central bank policy playing an ever critical role in metal price outcomes. With the central banks of the USA, Europe, Japan and China all likely to alter monetary policy settings in the year ahead, exchange rates are likely to be especially unpredictable as traders seek to second guess the actual policy moves ahead of the action being taken.
The views of central bankers about the appropriateness of policy are also evolving. Comments in the past week have intimated, if not explicitly demonstrated, that policymakers are becoming increasingly frustrated about the lack of progress toward their economic objectives.
Signs of Federal Reserve governors looking for a different paradigm to explain what is happening are surfacing.
In addressing the media at the conclusion of the Federal Reserve meeting on Wednesday, chair Janet Yellen seemed more hesitant than ever in depicting the economic outlook and the likely stance of policy.
Yellen repeatedly referred to outcomes as being surprising. She also had difficulty explaining why the Fed had been unable to implement its normalisation policy more quickly.
Once again, Yellen characterised the economic outlook of the Fed governors as changing only slightly. While true that the most recent changes in forecasts have been only slight and seemingly immaterial on their own, they are the latest in a long sequence of changes.
Viewed over a prolonged period, changes in interpretation about the state of the economy have been dramatic. In particular, the connection between the onset of higher inflation and improvement in labour market conditions has been well beyond the bounds of what had originally been expected.
The extent of the change in view was emphasised in the past week by comments from James Bullard, the president of the St Louis branch of the Federal Reserve.
Bullard said he thought only one interest rate rise this year was appropriate with no more before 2018. This is close to saying that interest rate normalisation is off the agenda.
While only one member of the committee, Bullard is influential. In any event, his view is a dramatic shift signalling a (possibly desperate) search for an alternative policy paradigm to replace one which has proven disappointingly unable to explain what has been happening to the U.S. economy.
Policymakers will have little ammunition to counter normal cyclical outcomes in the event growth slows let alone anything approaching another financial crisis. This suggests downside risks to an already very subdued set of anticipated outcomes.
The emerging change in policy perspectives has important implications for the mining industry outlook. It consolidates the impression that growth will not be sufficient to raise raw material usage enough to tilt market balances away from surplus leaving investors to face ongoing downward pressure on prices.