The Current View
A lengthy downtrend in sector prices had given way to a relatively stable trajectory after mid 2013 similar to that experienced in the latter part of the 1990s and first few years of the 2000s.
The late 1990s and early 2000s was a period of macroeconomic upheaval during which time sector pricing nonetheless proved relatively stable. That remains a possible scenario for sector prices.
Relative stability suggests a chance for companies genuinely adding value through development success to see their share prices move higher. This was the experience in the late 1990s and early 2000s.
The lower equity prices fall - and the higher the cost of capital faced by development companies - the harder it becomes to justify project investments.
Has Anything Changed?
A 1990s scenario remains the closest historical parallel although the strength of the US dollar exchange rate since mid 2014 has added an unusual weight to US dollar prices.
The first signs of cyclical stabilisation in sector equity prices have started to show. This has meant some very strong ‘bottom of the cycle’ gains but only after prices have already fallen by 70% or more in many cases leaving prices still historically low.
Funding for project development may have passed its most difficult phase at the end of 2015 with signs of deals being done and evidence that capital is available for suitably structured transactions.
Key Outcomes in the Past Week
The connection between oil and equity prices seemed closer during the week. The implications of the UK quitting the European Union loomed larger as a market influence.

Sadly, the killing of UK Labour MP and European Union supporter Jo Cox tempered the debate over whether the UK should stay in Europe. The arguments against continued membership seemed to lose some momentum after her death.
Polls suggested as much with the slim “leave” lead evident a week earlier having been pared back.
The still evenly balanced result was enough to buoy sterling and restore some lost market stability.
The Federal Reserve board meeting in the middle of the week resulted in some further winding back in expectations about how aggressively the Fed would seek to raise interest rates in the future.
Changing expectations about the speed of normalisation, combined with the more optimistic mood over UK membership of the European Union, had a modestly positive effect on equity prices.
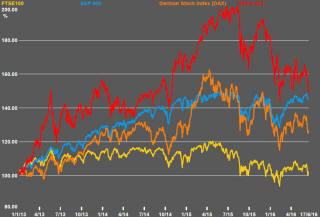
The S&P 500 had approached its previous record before again retracing its steps in the earlier part of the past week and before finishing 1% above its worst level. Bond yields pushed lower and into the realm of 2012 rates. The S&P 500 implied volatility measure had risen but fell 7.4% over the week.
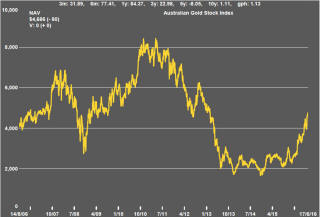
Gold prices moved higher although the maximum gain during the week of $42/oz could not be wholly retained. Nonetheless, the frequency of price outcomes around $1280-1300 is rising suggesting the possibility of an attack on higher prices if macro forces can generate enough momentum.
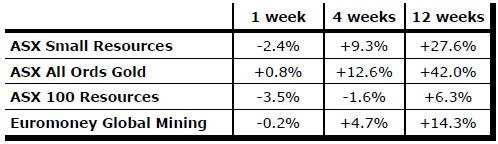
Resource sector prices were generally weaker. The
Australian gold stock index added just 0.8% despite greater optimism about
bullion prices. Otherwise, equity prices were lower with the larger stocks
again underperforming the smaller stocks in the sector.
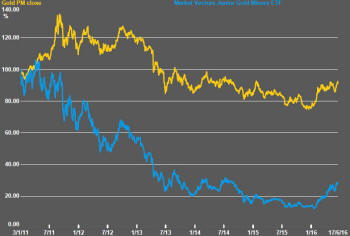
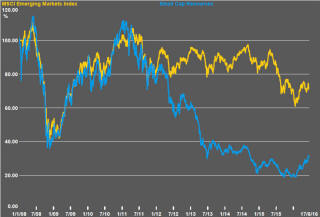
The leverage of gold equity prices to improvements in bullion prices in recent months has been particularly strong because of the earlier cyclical weakness in mining sector equity prices and, as a result, the extent to which they had underperformed gold bullion prices.
As the chart shows, since the beginning of 2011, the price of the Market Vectors Junior Gold Miners exchange traded fund (shown in the blue line) has fallen 71.8% while the gold price (in yellow) has fallen just 7.6%. Since the beginning of 2016, the equity fund price has risen 109.8% in response to the gold bullion price rise of 22.4%.
The full extent of this leverage is likely to diminish as gold prices move higher but the responsiveness of equity prices among the smaller companies in the industry should remain evident as long as their prices are still so far below where they had been five years ago.
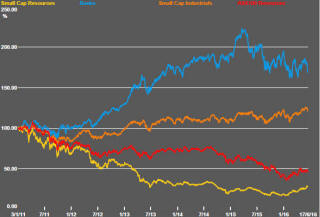
The bottom of the cycle leverage evident in the performance of a range of small cap stocks remains a feature of the market with Phase I stocks in the PortfolioDirect portfolio declining the least, although declining prices outnumbered appreciating prices across all development categories.
Market Breadth Statistics