The Current View
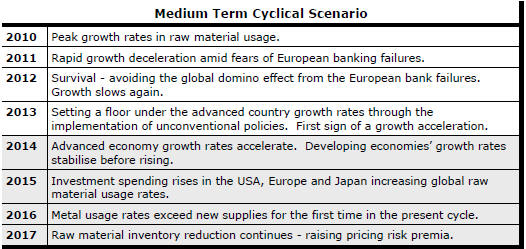
Growth in demand for raw materials peaked in late 2010. Since then, supply growth has continued to outstrip demand leading to inventory rebuilding or spare production capacity. With the risk of shortages greatly reduced, prices have lost their risk premia and are tending toward marginal production costs to rebalance markets.
To move to the next phase of the cycle, an acceleration in global output growth will be required to boost raw material demand by enough to stabilise metal inventories or utilise excess capacity.
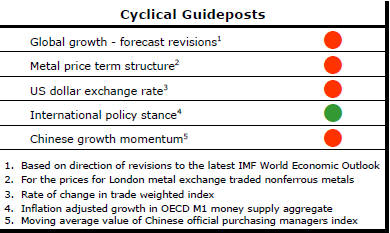
The PortfolioDirect cyclical
guideposts suggest that the best possible macroeconomic circumstances for
the resources sector will involve a sequence of upward revisions to
global growth forecasts, the term structure of metal prices once again
reflecting rising near term shortages, a weakening US dollar, strong money
supply growth rates and positive Chinese growth momentum. Only one of
the five guideposts is "set to green" suggesting the sector remains confined
to the bottom of the cycle .
Has Anything Changed?
Throughout 2014, PortfolioDirect had been characterising the cyclical position as ’Trough Entry’ with some expectation that by the end of 2014 an exit would be evident. Until very late in the year, the evidence supported that possibility before conditions took several backward steps.
The absence of a growth acceleration among the major economic regions is contributing to the flagging momentum. A stronger US dollar is also imparting a downward bias to US dollar denominated prices presently. This is looking less like a temporary move than a multiyear change of direction.
The flow of metal market statistics is pointing to a marked slowing in usage growth in 2015.
US Monetary Policy Set to Move
Preoccupation with the timing of the first Federal Reserve interest rate
increase is reaching a crescendo. In testifying before the U.S. Congress
last week, Fed chair Janet Yellen made it abundantly clear that she wanted
to raise rates sooner rather than later. In flagging her wish to get the
process of rate normalisation under way, she was at pains to emphasise that
the timing of the first rate rise was far less important than the trajectory
and speed of subsequent rises. Moreover, the longer the first increase is
delayed, she argued, the more aggressive subsequent increases will need to
be.
Yellen copped some flak from legislators when testifying about the effect on markets of Federal Reserve decision-making. The Fed under both Bernanke and Yellen has put considerable effort into framing its forward guidance for markets with the release of meeting minutes, forecasts and press conferences. Yellen is fond of saying that no central bank is as transparent in its policymaking as the U.S. Federal Reserve.
Despite this effort, markets have continually been
preoccupied with what the Fed is likely to do and very easily spooked by
even apparently minor changes in policy emphasis or perceptions of possible
changes.
In last week’s hearings, Yellen was strongly criticised for eschewing a rules based approach to monetary policy in favour of the more discretionary policy approach in use. Yellen’s critics maintained that references to decisions being data dependent leave market participants none the wiser if no one knows what data the Fed will depend upon in making its decisions. The Fed, they say, is confusingly changing the data on which it bases its decisions so frequently as to negate its attempts at forward guidance.
At the heart of the controversy is a fear about how markets will react to the first shift in the policy gears. This implies that markets have not been sufficiently forward looking to take account of the inevitable change in policy settings. An economist like Yellen would be trained to believe that the imminence of a U.S. interest rate rise should be taken as a sign of strengthening economic conditions but the market reaction will also depend on what is happening at the same time in the USA and elsewhere.
Global bond yields have already appeared to be adjusting to changing conditions. US 10 year yields have tended to gravitate to a 150 basis point difference with German yields, for example. If U.S. bond yields have already adjusted to future anticipated changes in short term interest rates, as they should have done, subsequent yield movements should reflect movements in European and Japanese yields where policies are maintaining downward pressure with little impact for the Fed decision alone.
Euro Area Growth Contained
There were clear signs through 2014 of a broadening in the base of economic
activity in Europe. This shows in the growth diffusion index based on the
monthly industrial production statistics published by the European
Statistical Agency.
 Each
bar measures the extent to which there are more European national economies
reporting an expansion in output than a contraction. For the region to be
firing on all cylinders, the bars should be pushing toward a reading of
100.
Each
bar measures the extent to which there are more European national economies
reporting an expansion in output than a contraction. For the region to be
firing on all cylinders, the bars should be pushing toward a reading of
100.
There has been little progress over the last six months in broadening this base of activity. Without that, the European region looks set to sustain a higher growth rate than would have prevailed through 2013 but nothing significantly better than what had been achieved in 2014.