The Current View
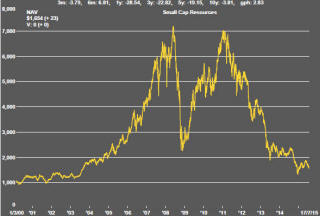
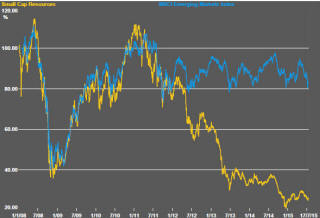
A lengthy downtrend in sector prices had given way to a relatively stable trajectory after mid 2013 similar to that experienced in the latter part of the 1990s and first few years of the 2000s.
The late 1990s and early 2000s was a period of macroeconomic upheaval during which time sector pricing nonetheless proved relatively stable. That remains a possible scenario for sector prices.
Relative stability suggests a chance for companies genuinely adding value through development success to see their share prices move higher. This was the experience in the late 1990s and early 2000s.
The lower equity prices fall - and the higher the cost of capital faced by development companies - the harder it becomes to justify project investments. The market is now entering a period prone to even greater disappointment about project delivery .
Has Anything Changed?
The assumption that June 2013 had been the cyclical trough for the market now appears premature.
Sector prices have adjusted to the next level of support. The parallel with the 1990s illustrated in Chart 4 is being tested. Prices will have to stabilise around current levels for several months for the thesis to hold.
Key Outcomes in the Past Week
U.S. equity indices returned to record or near record levels by the end of the week as investors seemed to shrug off their anxieties about Greece and China. More positively, better than expected earnings results from several high profile U.S. companies including Google helped to sustain higher index levels despite a loss of momentum due to lower oil prices and a stronger U.S. dollar.
Oil and gold prices both fell as the U.S. dollar rose 1.9% against a basket of leading currencies. Oil prices were also affected adversely by Iran’s agreement to limit its nuclear power program. While the Iranian agreement could be construed as reducing Middle East tensions in the near term, it also heralds an increase in global oil supplies in an already oversupplied market.
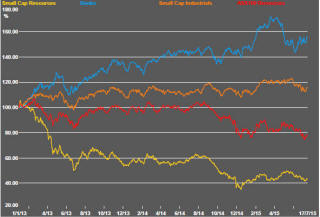
The more positive equity market tone for most of the week resulted in a 3.8% increase in the small resources share price index. The S&P/ASX 100 resources index rose by 2.0% in a repetition of the recent experience in which the smaller end of the resources market has been performing more strongly.
Gold Equities Need More Bullion Support
Gold equities need the periodic adrenaline rush which comes with a rising
gold price to sustain performance. The chart illustrates the leveraged
response of gold equity prices (using the NYSE gold "BUGS" index ) to
movements in the gold bullion price since the beginning of 2014.
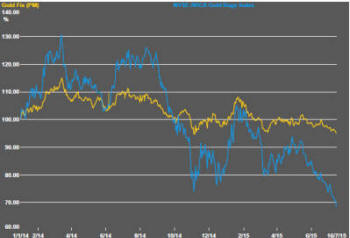
Unsurprisingly, the 7% fall in the gold price since late May 2015 has come with a larger fall - 25% - in equity prices. Gold equity prices are now set up for a 4-5X multiple response in the event of a rise in gold prices. From this perspective, the short term balance of risks has tilted in favour of equities.
Without a higher gold price, however, margins will be compressed by rising costs and valuations eroded. A continuing fall in the gold price - even at the recently gentle pace - will erode already slim profit margins implying an accelerating fall in equity values.
This plays into the longer term theme that the balance of risks favours holding physical gold (or a paper representation) rather than the equity equivalent.
Market Needs S&P Earnings Uplift
The responsiveness of the market to changes in earnings varies through the
cycle; hence the non-linear trend line in the chart showing the relationship
between quarterly earnings outcomes and the S&P500 share price index since
1988. While the impact of earnings changes varies, rising earnings have
been a necessary condition for a rising market.
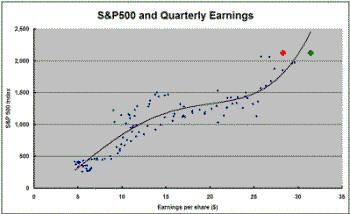 The
estimate for S&P500 earnings in the June quarter of $28.29 per share (shown
in the red marker in the chart) is 9.6% higher than operating earnings in
the preceding March quarter and 3.6% lower than earnings in the 2014 June
quarter.
The
estimate for S&P500 earnings in the June quarter of $28.29 per share (shown
in the red marker in the chart) is 9.6% higher than operating earnings in
the preceding March quarter and 3.6% lower than earnings in the 2014 June
quarter.
The backward step in earnings over the past year has been saved by the broader macroeconomic environment and, in particular, the beneficial valuation effects of lower interest rates.
The relatively modest future earnings uplift implied by currently expected December quarter 2015 earnings shown by the green marker would be consistent with further market gains if the highly favourable market environment of the past several quarters was to persist. Those conditions may not last if bond yields have stopped falling and the Federal reserve begins pushing interest rates toward more normal levels.
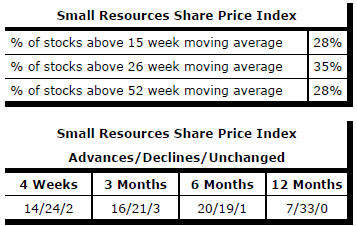
Market Breadth Statistics