The Current View
Growth in demand for raw materials peaked in late 2010. Since then, supply growth has continued to outstrip demand leading to inventory rebuilding or spare production capacity. With the risk of shortages greatly reduced, prices have lost their risk premia and are tending toward marginal production costs to rebalance markets.
To move to the next phase of the cycle, an acceleration in global output growth will be required to boost raw material demand by enough to stabilise metal inventories or utilise excess capacity.
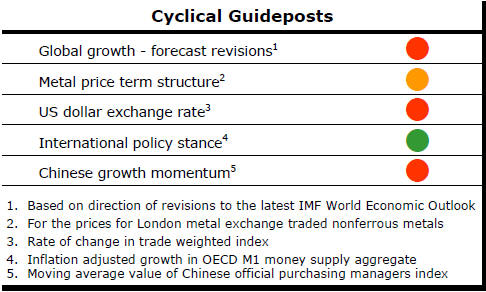
The PortfolioDirect cyclical
guideposts suggest that the best possible macroeconomic circumstances for
the resources sector will involve a sequence of upward revisions to
global growth forecasts, the term structure of metal prices once again
reflecting rising near term shortages, a weakening US dollar, strong money
supply growth rates and positive Chinese growth momentum. Only one of
the five guideposts is "set to green" suggesting the sector remains confined
to the bottom of the cycle .
Has Anything Changed? - Updated View
Since mid 2014, the metal market cyclical position has been characterised as ‘Trough Entry’ as prices have remained in downtrend with all but one of the PortfolioDirect cyclical guideposts - the international policy stance - flashing ‘red’ to indicate the absence of support.
The absence of a global growth acceleration, a stronger dollar and flagging Chinese growth momentum remain critical features of the current cyclical positioning.
Through February 2016, the first signs of cyclical improvement in nearly two years started to emerge. After 15 months of contango, the metal price term structure shifted to backwardation reflecting some moderate tightening in market conditions.
The metal price term structure is the most sensitive of the five cyclical guideposts to short term conditions and could, consequently, quickly reverse direction. Nonetheless, this is an improvement in market conditions and the guidepost indicator has been upgraded to ‘amber’ pending confirmation of further movement in this direction.
Central Banks Doubt Growth Rebound
Decisions about interest rates by the U.S. Federal Reserve last week (and
monetary policy moves by the ECB a week before) have done more to highlight
the challenging cyclical outlook confronting the resources industry.
Neither Europe nor the USA, together accounting for 28% of global output, shows signs of contributing the missing growth momentum vital to a cyclical improvement in commodity prices.
The ECB raised hopes in its 10 March policy statement that it was going to take fresh steps to improve economic outcomes but central bank president Mario Draghi has said before, in an effort to spur markets, that the bank would do whatever it takes. Talk of policy ‘bazookas’ has come and gone. There is legitimate scepticism about the bank’s courage to act.
The ECB also highlighted once again the limitations of its power to affect growth outcomes. A key objective of the “substantial monetary stimulus”, the bank said, was to secure an acceleration in inflation to 2% “without undue delay” leaving growth as a second order objective for the time being.
While growth and inflation outcomes may be connected, preventing a downward inflation spiral is the more urgent priority. This is wise economic policy but a signal for the resources industry that an unusually prolonged wait is in store for the growth pickup on which cyclical progression relies.
Last week, the Fed updated how each of the board governors thought the Fed Funds rate would evolve over the two years ahead. Since December, when the forecasts were last published, the governors have revised down the number of expected rate rises in 2016.
Such downward revisions would normally suggest a loss of confidence about the path of employment growth or how quickly inflation would return to their targeted 2% rate. The governors also failed to repeat their December observation that the risks were “balanced”. And, while board chair Yellen tried to avoid conceding under media questioning that the risks had turned negative, the implication was clear enough.
Less aggressive interest rate moves come with a slight lowering in anticipated U.S. growth. The governors’ median expectations for GDP growth in 2016 and 2017 are 2.2% and 2.1%, respectively, as the economy settles into a longer run 1.8-2.4% growth path.
There is ample evidence of the world’s principal central banks being unsure of the impact of their low interest rate policies but, for the foreseeable future, an outlook of low growth and large directional swings in exchange rates with negative implications for commodity prices appears on the cards.
Euro Area Growth Struggles
Euro area industrial output rebounded 2.1% in January but that came after
output had contracted in eight out of the preceding 12 months. Production
was 3.0% higher in January than in January 2015. 
The growth rate posted over the year to January was the highest rate of growth over any 12 month period since November 2012 highlighting the economic predicament confronting the region and the heavy constraint it imposes on a resources industry desperately in need of an economic activity acceleration to progress the commodity price cycle.
The spread of growth across the region offers a further perspective on the underlying momentum. The ‘EU area growth diffusion’ chart shows how widely spread across the region economic expansion can be found.
 During
the middle of 2015, the number of countries participating in albeit moderate
growth outcomes was increasing. The widening spread of output growth offered
some hope that the pace could become self-reinforcing with momentum building
on itself.
During
the middle of 2015, the number of countries participating in albeit moderate
growth outcomes was increasing. The widening spread of output growth offered
some hope that the pace could become self-reinforcing with momentum building
on itself.
That apparent improvement fell away late in the year and even the January rebound has been relatively confined geographically. For the time being, the spread of European activity seems at risk of slipping back to where it had been in 2014.