The Current View
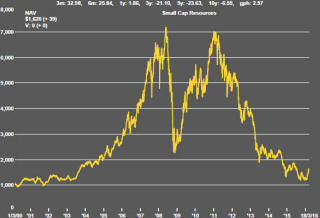
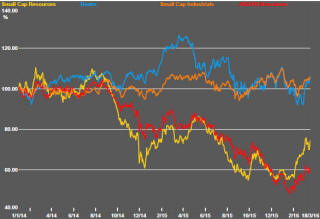
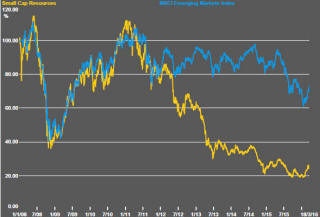
A lengthy downtrend in sector prices had given way to a relatively stable trajectory after mid 2013 similar to that experienced in the latter part of the 1990s and first few years of the 2000s.
The late 1990s and early 2000s was a period of macroeconomic upheaval during which time sector pricing nonetheless proved relatively stable. That remains a possible scenario for sector prices.
Relative stability suggests a chance for companies genuinely adding value through development success to see their share prices move higher. This was the experience in the late 1990s and early 2000s.
The lower equity prices fall - and the higher the cost of capital faced by development companies - the harder it becomes to justify project investments.
Has Anything Changed?
A 1990s scenario remains the closest historical parallel although the strength of the US dollar exchange rate since mid 2014 has added an unusual weight to US dollar prices.
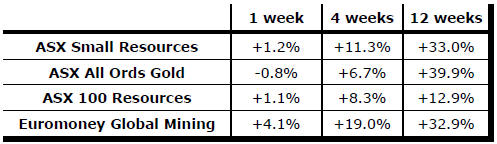
The first signs of cyclical stabilisation in sector equity prices have started to show. This has meant some very strong ‘bottom of the cycle’ gains but only after prices have already fallen by 70% or more in many cases leaving prices still historically low.
Funding for project development may have passed its most difficult phase at the end of 2015 with signs of deals being done and evidence that capital is available for suitably structured transactions.
Key Outcomes in the Past Week
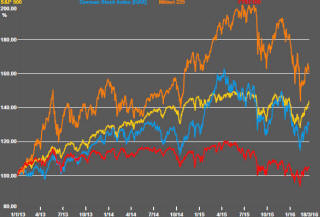
Consistent with recent trading patterns, the U.S. equity market continued to track the upward drift in crude oil prices in the past week.
There is no sound analytical reason why both should continue to move higher in lockstep.
Eventually, one or both markets will reach a point that reflects (or exceeds) what the next investor is prepared to pay precipitating a retracement in one or both markets.
The S&P 500 has risen 12% since 11 February possibly now having risen too far in too short a time and leaving it vulnerable to profit taking.
The CBOE S&P 500 volatility index has declined t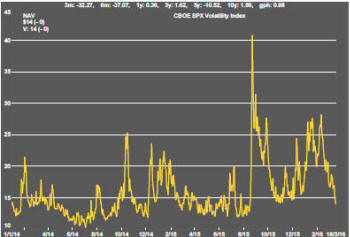 o
14, toward the low end of its historical trading range and the lowest point
since August 2015. While it could stay at around current levels for a
prolonged period, the next directional move is now likely to be upward with
a decline in market prices.
o
14, toward the low end of its historical trading range and the lowest point
since August 2015. While it could stay at around current levels for a
prolonged period, the next directional move is now likely to be upward with
a decline in market prices.
Oil market conditions do not appear to have improved enough to warrant significant further re-pricing of crude. There is some controversy among analysts about whether the International Energy Agency has ‘lost’ up to 800,000 barrels of oil by underestimating demand or overestimating supply because of inadequate information coming from outside the OECD area. Even adjusting for this possibility would leave the market oversupplied for the time being.
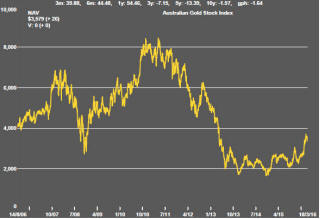
The upward trajectory of the gold price failed to
convincingly break through the upper end of the trading channel within which
it has been confined for three years. The macro picture has not changed
sufficiently to alter the longer term direction of prices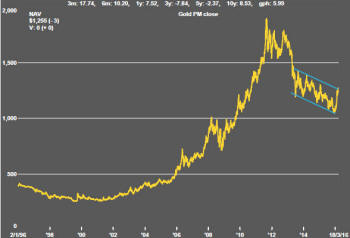 .
.
Gold prices will have benefited from a weaker dollar and changing expectations about interest rates. Not being able to set a new direction with both of these influences working in favour of higher prices reinforces a conclusion that it simply may not have enough momentum to change direction.
The lowered U.S. dollar has continued to support industrial metal and gold prices in the short term but the trajectory of U.S. interest rates, as confirmed by the U.S. Federal Reserve policymakers last week, and their likely impact on the currency will reassert downward pressure in the second half of 2016.
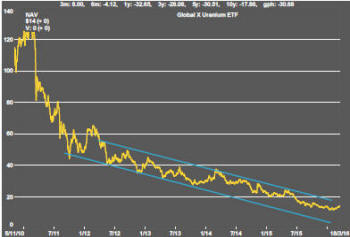
Uranium Fails to Keep Pace
The uranium market outlook is generally thought to be stronger than the
market outlook for other raw materials because of the confirmed longer term
growth in nuclear power generation capacity. At some stage, utilities will
need to re-enter the market to lock in longer term supplies.
Surprisingly, against this background, ASX listed uranium exposed equities have shown little tendency to perform better than companies exposed to other parts of the mining industry. Companies such as Bannerman Resources, Toro Energy, Peninsula Energy and Deep Yellow have produced returns between -29% and +11% so far in 2016.
The price of the Global X uranium ETF has persisted in a downtrend to produce a 3.4% return since the end of 2015 (against a 27% return in the Euromoney global mining index and a 25% return in the ASX small resources share price index).
Within that timeframe, however, uranium exposed equities generally appear to have reconnected with the broader energy complex. Since the turn in oil prices on 11 February, the Global X uranium ETF has added 24%.
That still leaves the Australian companies referred to above lagging behind. Over the same timescale, their average return has been +0.5% while the ASX small resources share price index has added 17%.
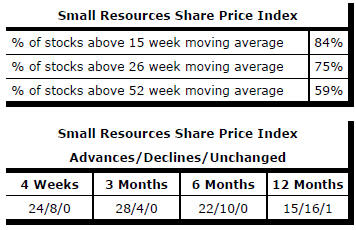
Market Breadth Statistics