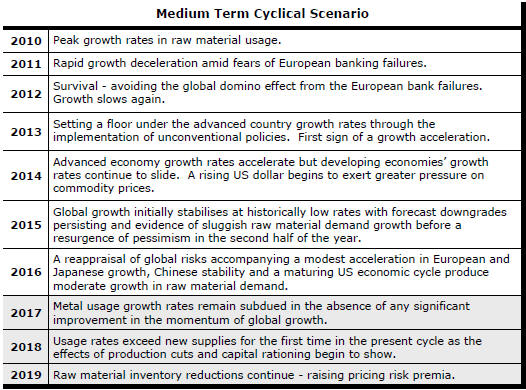
The Current View
Growth in demand for raw materials peaked in late 2010. Initially, supply growth had outstripped demand leading to inventory rebuilding or spare production capacity. With the risk of shortages greatly reduced, prices lost their risk premia and tended toward marginal production costs to rebalance markets.
The PortfolioDirect cyclical guideposts suggest that the best possible macroeconomic circumstances for the resources sector will involve a sequence of upward revisions to global growth forecasts, the term structure of metal prices once again reflecting rising near term shortages, a weakening US dollar, strong money supply growth rates and positive Chinese growth momentum.
Two of the five guideposts are "set to green" suggesting the most arduous part of the cyclical adjustment has passed. Although conditions have improved, the principal macroeconomic drivers do not yet appear to have sufficient momentum to carry the cycle into the upswing phase.

Has Anything Changed? - Updated View
From mid 2014, the metal market cyclical position was characterised as ‘Trough Entry’ with all but one of the PortfolioDirect cyclical guideposts - the international policy stance - flashing ‘red’ to indicate the absence of support.
Through February 2016, the first signs of cyclical improvement in nearly two years started to emerge. The metal price term structure reflected some moderate tightening in market conditions and the guidepost indicator was upgraded to ‘amber’ pending confirmation of further movement in this direction.
As of early December 2016, the Chinese growth momentum indicator was also upgraded to amber reflecting some slight improvement in the reading from the manufacturing sector purchasing managers index. Offsetting this benefit, to some extent, the policy stance indicator was been downgraded from green to amber.
At the end of July 2017, the exchange rate guidepost was upgraded to green.
As 2017 ended, there were emerging signs economic forecasters may have begun a sequence of growth forecast upgrades prompting a revision of the global growth guidepost to "green".
Cyclical Position
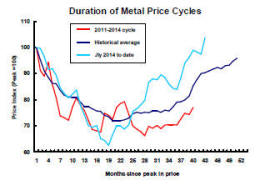
Forty months after their peak, metal prices should have passed their nadir and be heading higher, as they are. The trajectory of prices is not materially different from the historical average this far into a cycle.
Time, of itself, is not important but the sequence of adjustments which contribute to higher prices and changed expectations take time.
Based on the historical averages, a pullback is now more likely than further rises. A pullback is not a necessary outcome but an alternative result would most likely require some combination of higher growth, further U.S. dollar weakness or a period of more supportive monetary policies.
There is no assurance presently that any of those three factors will favour the cycle progressing significantly beyond its present position.
The balance of risks suggests a more moderate appreciation in metal prices.
Global Growth - Forecast Revisions
Improved mining industry fortunes now depend on US tax cuts spurring growth, the UK and European governments negotiating a growth enhancing Brexit pact and China being able to cut back runaway lending without disrupting output growth.
Estimates of the growth impact of the US tax policy changes keep the resulting GDP growth trajectory at 2-3%. Even the most ardent advocates of the changes accept that growth is likely to peak during the first phase of the tax changes and before temporary benefits are withdrawn.
Brexit negotiations have made progress but so complex
are the issues that trade deals
between Britain and the remaining European countries or others outside
Europe are possibly years away. Prime Minister
May's slim parliamentary majority continues to limit her freedom to finalise
a result without further scrutiny and uncertainty about outcomes.
The IMF announced on 10 October that it had raised its forecast for global growth in 2017 to 3.6% from 3.4% at the time of the corresponding forecast round last year and after a 3.2% expansion of the global economy in 2016.
This month, the World Bank announced that it had raised its global GDP growth forecast for 2018 from 2.9% to 3.1%. The forecast for 2019 was raised from 2.9% to 3.0%.
On 22 January, the IMF again revised its forecasts for 2018 and 2019 - adding 0.2 percentage points to its earlier forecasts for each year.
The upgrades to the global growth outlook by the two international organisations ostensibly contained some of the best news for the mining industry since 2010.
The strongest increases in metal usage typically occur when global GDP growth is accelerating.
Rising growth projections are usually a prompt for
strategists to raise sectoral fund allocations.

The macroeconomic risk profile has shifted significantly in favour of the mining industry.
The not so good news is that 2017 is nearly as good as it gets, in the eyes of the Fund and the World Bank.
Growth has risen but the positive momentum on which strengthening growth in raw material demand relies is almost nonexistent.
Much of the anticipated growth improvement in 2018 is due to an acceleration in growth through 2017. The IMF annual forecasts imply growth of 3.9% between the fourth quarter of 2018 and the corresponding period a year earlier, the same as has already occurred over the year to the end of 2017. The forecast for growth over the year ended December 2019 is little different at just 3.8%.
Among the advanced economies, according to the IMF October review, growth by 2022 is expected to be 0.5 percentage points lower than in 2017 as economic slack is eliminated.
Chinese growth is expected to decline by a full percentage point.
Any global growth improvement is expected to come entirely from emerging market economies outside China in Latin America, the Middle East and sub-Saharan Africa.
The World Bank growth forecasts portray a similar picture of slightly stronger and lower risk growth in the immediate future but, after that, little difference in the coming three years than the average over the past eight years.
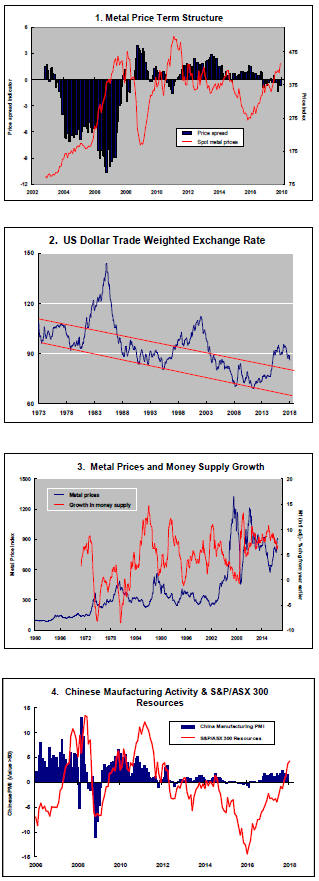
US Dollar Exchange Rate- Chart 2
Much of the upward trajectory in metal prices through 2017 has been contributed by a weaker U.S. dollar.
The currency adjustment reflected some reappraisal of relative growth rates and the direction and pace of interest rate changes.
In particular, a rethink occurred about the length of the lag between the U.S. Federal Reserve beginning to tighten its monetary policies and the European Central Bank going down the same path.
With the prospect of a fiscal filip to the U.S. economy in 2018 and 2019 from tax cuts, an eventual move higher in the U.S. dollar becomes a stronger possibility.
In the nearer tem, since the impact of the tax cuts remains uncertain, greater currency volatility might ensue as speculation occurs about how the dollar will be affected.
A negative influence in the near term will be the reduced need in a less risky macro environment for recourse to the dollar as a safe haven. European, Japanese and emerging market currencies will be looking more attractive until there is clearer evidence of an investment recovery in the USA due to the introduction of the new tax regime.
International Policy Stance - Chart 3
Global monetary policies had been set to support higher asset prices as a step toward raising demand and creating stronger employment markets.
While the emphasis on these policies is being reduced as growth becomes more self sustaining, monetary accommodation remains historically strong.
Metal prices are affected by monetary conditions with a lag of several quarters so that there is no imminent threat from future winding back in monetary support but the prospective trajectory of monetary policy will be a source of eventual downward pressure on metal prices.
As some of the most favourable monetary conditions in modern history are wound back, the mining industry will be relying more heavily on output growth and, for that, on the policy dexterity of Messrs Trump, Xi and May.
Metal Price Term Structure - Chart 1
Some modest tightening in nonferrous metal price spreads has been occurring over the past several months driven by emerging backwardations in London Metal Exchange lead and zinc prices.
The tightening in spreads is modest by the standards of what might be possible but overall physical market balances do not appear to be changing enough for the shift in premiums to move more dramatically.
The International Copper Study Group (ICSG) has reported that demand for the metal in the 10 months to October 2017 had risen by 0.2% from the corresponding period of 2016.
The ICSG has estimated that there was a slight increase in global metal inventories between the end of October 2016 and the end of October 2017.
The International Lead Zinc Study group has reported that zinc usage in the first 11 months of 2017 increased by only 1.9%, also below the 3%-plus historical rates of nonferrous metal consumption growth.
The unusually weak expansion in zinc usage has coincided with lowered metal production after mine output fell in 2016. The changing production profile has prevented the inventory build that might have otherwise occurred.
With only moderately increasing or falling rates of usage across the major daily traded metals, relatively narrow metal price spreads may indicate market conditions are insufficiently strong (and possibly subject to reversal if producers choose to do so) to carry the cycle significantly further.
Chinese Growth Momentum - Chart 4
Chinese manufacturing has enjoyed a prolonged expansion
during 2017 which has helped build positive sentiment for investments in the
mining sector (as illustrated in the fourth chart in the right hand panel).
Current Chinese growth rates remain highly dependent on the accommodative lending policies of the central government.
The dependence on financial leverage comes despite widespread agreement that the flow of funds is unsustainable and creating longer term distortions which will need addressing.
There is no prospect of more accommodating policy settings than have been in place for the past several years, biasing any cyclical risks for raw material markets to the downside.
 The restructuring of the Chinese economy with the
resulting contraction in the contribution to Chinese GDP of investment
spending will have a generally detrimental effect on raw material demand.
The restructuring of the Chinese economy with the
resulting contraction in the contribution to Chinese GDP of investment
spending will have a generally detrimental effect on raw material demand.
Chinese steel production in 2017 is set to remain at around the same levels as in the past three years.
Other signs of subdued momentum have been evident in statistics released by the International Copper Study Group and the International Lead Zinc Study group which show global per capita metal usage rates remaining little changed for four consecutive years.
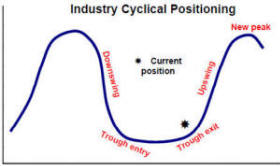 The chart illustrates the cyclical classifications used to define the positioning of the metal markets. The
cyclical positioning informs recommendations about the allocation of funds within the sector.
The chart illustrates the cyclical classifications used to define the positioning of the metal markets. The
cyclical positioning informs recommendations about the allocation of funds within the sector.