The Current View
Growth in demand for raw materials peaked in late 2010. Since then, supply growth has continued to outstrip demand leading to inventory rebuilding or spare production capacity. With the risk of shortages greatly reduced, prices have lost their risk premia and are tending toward marginal production costs to rebalance markets.
To move to the next phase of the cycle, an acceleration in global output growth will be required to boost raw material demand by enough to stabilise metal inventories or utilise excess capacity.
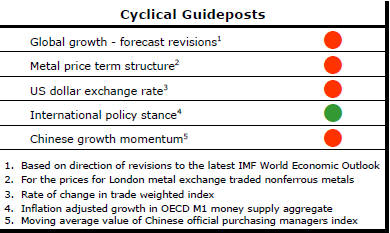
The PortfolioDirect cyclical
guideposts suggest that the best possible macroeconomic circumstances for
the resources sector will involve a sequence of upward revisions to
global growth forecasts, the term structure of metal prices once again
reflecting rising near term shortages, a weakening US dollar, strong money
supply growth rates and positive Chinese growth momentum. Only one of
the five guideposts is "set to green" suggesting the sector remains confined
to the bottom of the cycle .
Has Anything Changed?
Throughout 2014, PortfolioDirect had been characterising the cyclical position as ’Trough Entry’ with some expectation that by the end of 2014 an exit would be evident. Until very late in the year, the evidence supported that possibility before conditions took several backward steps.
The absence of a growth acceleration among the major economic regions is contributing to the flagging momentum. A stronger US dollar is also imparting a downward bias to US dollar denominated prices presently.
This change has been enough to define a fresh cycle and a more prolonged adjustment process.
China Cops the Blame
The bad news is that Chinese growth is slowing. The good news is that
Chinese growth is slowing. If China was not slowing it would most likely be
careering out of control leaving markets even more shaky than they are now.
There is widespread agreement among policymakers within and outside China that its economic restructuring is desirable and yet China is being blamed for financial market instability.
Perhaps a distinction needs to be made between a slowdown in China and the appearance of fumbling among Chinese policymakers.
For the best part of two decades, Chinese policymakers had given the impression of making every move a winner. This was facade rather than reality although they had one overriding advantage over their peers in other countries. For much of that time, Beijing powerbrokers could shoot people who were uncooperative.
As their enforcement powers diminished, they began to look more human. Over time, too, the impact of their early reforms became less potent and more recent reforms proved less dramatic. Like the dam wall being broken, an initial torrent eventually dwindles to a trickle. The force of early economic liberalisation efforts has largely run its course. There may be insufficient new reform initiatives available to sustain growth even if Chinese leaders were of a mind to adopt them.
Superimposed on these structural changes is a possible cyclical loss of momentum. The distinction between structural and cyclical adjustment is blurred. Doubts about their relative importance are the source of some hesitation in taking more decisive monetary or fiscal steps. In the absence of a clear-cut need to deal with a cyclical problem, policies aimed at stimulating short term growth might simply exacerbate the structural problems or remove some of the incentive to act against them.
A Handy Excuse
China is proving a handy excuse. Companies can easily refer to a China
slowdown to paper over shortcomings in business strategies. In some cases,
companies have failed to do enough to understand what was happening in China
to safeguard future business outcomes. The large mining companies and
trading houses fall squarely into this category.
Some companies are adversely affected by China’s economic restructuring but, more broadly, national governments everywhere are trying to cope with structural constraints on their growth performance which have arisen within their own boundaries rather than from China.
In Europe, the USA and Japan, demographic factors or inadequate investment in infrastructure have curtailed growth. Among the largest Latin American economies, politics has detrimentally affected performance through the choice of poor economic priorities and, in some instances, financial mismanagement. Russia and middle eastern oil producers have lost income from fallen oil prices. Even India has fallen short of the potential prime minister Modi had promised when he was elected.
The complexity of these influences which are likely to persist even in the event China stabilises its growth path makes it tempting to sheet home the blame to China where possible.
US Business Sales Recession
The US economy appears stronger than its equity market. The relative
economic strength relies primarily on the impact of the household sector
which accounts for two-thirds of GDP.
The chart shows sales growth among the S&P 500 companies
(in the blue line) and business sales on an economy-wide basis as reported
by the Department of Commerce (in the red line).
Over the year to the end of December 2015, sales on these two measures declined by 2.4% and 2.8%, respectively. In other words, there has been little difference between the sales performance of the companies reflected in the mainstream equity market and the broader US economy.
Without some form of exogenous shock, business sales are unlikely to expand dramatically. A 3-5% expansion track seems around the potential in the foreseeable macroeconomic environment.
If S&P 500 sales are running at a similar pace, the coming year may simply record a sales recovery. Earnings would correspondingly fall short of their peak levels for another three years based on existing operating margins. Without the force of the Federal Reserve behind them, equity prices are prone to languish.
This outlook is far more complicated than if it was arising primarily from China’s growth slowdown. It is just as much about low US productivity, exchange rate changes and widespread constraints on growth among potential US trading partners.
European Growth Stalls
European growth appears to have reached its potential proving a challenge
for a mining industry looking for better market conditions.
The latest survey of professional forecasters conducted by the European Central Bank raises the prospect of little or no growth upside in the European region for the foreseeable future.
 The
latest quarterly survey was conducted in early January. Its 57 respondents
showed no sign of budging from their previously expressed expectation of a
1.7-1.8% growth rate over 2016 and 2017. They also thought growth would
stick around 1.7% in the longer term.
The
latest quarterly survey was conducted in early January. Its 57 respondents
showed no sign of budging from their previously expressed expectation of a
1.7-1.8% growth rate over 2016 and 2017. They also thought growth would
stick around 1.7% in the longer term.
Despite much talk about uncertainty and volatility, the opposite is closer to the truth. There is a strong consensus about the growth outlook and little expectation of increased variability in future rates of growth among professional forecasters.
The temptation to embrace terms like uncertainty and volatility seems to arise when the outlook is not as favourable as people would like. Rapidly rising growth or sustained high growth, when it occurs, is rarely characterised in a similar way even when, technically, it may be more volatile and less certain in any strict sense of those terms.
The anticipated moderate growth environment would normally lead to lower than average raw material demand. It also makes meeting demand less challenging than if market outcomes are less certain. The likelihood of being caught by a surprise surge in demand is diminished. That, in turn, makes for a less volatile price environment.