The Current View
Growth in demand for raw materials peaked in late 2010. Since then, supply growth has generally outstripped demand leading to inventory rebuilding or spare production capacity. With the risk of shortages greatly reduced, prices lost their risk premia and have been tending toward marginal production costs to rebalance markets.
The missing ingredient for a move to the next phase of the cycle is an acceleration in global output growth which boosts raw material demand by enough to stabilise metal inventories or utilise excess capacity.
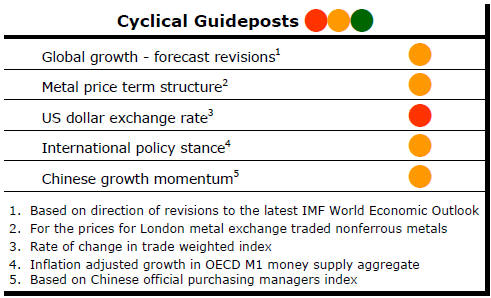
The PortfolioDirect cyclical
guideposts suggest that the best possible macroeconomic circumstances for
the resources sector will involve a sequence of upward revisions to
global growth forecasts, the term structure of metal prices once again
reflecting rising near term shortages, a weakening US dollar, strong money
supply growth rates and positive Chinese growth momentum. None of the five guideposts is "set to green"
(after the most recent adjustments in December 2016) suggesting the sector remains confined
to near the bottom of the cycle.
Has Anything Changed? - Updated View
From mid 2014, the metal market cyclical position was characterised as ‘Trough Entry’ with all but one of the PortfolioDirect cyclical guideposts - the international policy stance - flashing ‘red’ to indicate the absence of support.
Through February 2016, the first signs of cyclical improvement in nearly two years started to emerge. The metal price term structure reflected some moderate tightening in market conditions and the guidepost indicator was upgraded to ‘amber’ pending confirmation of further movement in this direction.
As of early December 2016, the Chinese growth momentum indicator was also upgraded to amber reflecting some slight improvement in the reading from the manufacturing sector purchasing managers index. Offsetting this benefit, to some extent, the policy stance indicator has been downgraded from green to amber. While monetary conditions remain broadly supportive, the momentum of growth in money supply is slackening while further constraints on fiscal, regulatory and trade regimes become evident.
Metal Prices Track Investment Trends
Metal prices have rolled over after pushing higher since mid-2016. The
cyclical positioning chart in the panel on the right shows prices edging
toward their third successive monthly fall.
Prices remain above average for the current duration of the cycle but are heading back to average levels.
The momentum change is impacting negatively on the direction of equity prices.
The metal price movements are also consistent with the pattern of global growth.
Although some of the biggest risks to global growth have dissipated and the balance of risks has tilted in favour of an ongoing expansion, expected growth outcomes are modest by historical standards.
Where higher growth rates are being discussed, such as in the USA after the presidential election, forecasters are being accused of overoptimism by suggesting GDP can expand at 3% rather than the 2% pace it has been battling to reach in recent years.
Capital spending is an important ingredient missing from
the growth mix in the USA and globally. 
The blue bars in the chart show changes in global investment spending since 1980. The chart shows periods of investment growth have typically coincided with strengthening metal prices.
The chart also shows investment falling in 2015 and 2016. The decline is equivalent to US$1,100 billion, according to data from the International Monetary Fund.
Neither private nor public sector investors seem motivated to spend more. Markets are not expanding fast enough to prompt business investors to expand capacity. Governments in both the advanced and developing world, meanwhile, are too indebted to fund more spending.
As described in The Mining Strategist last week, the only green bush on an otherwise arid investment landscape is China’s One Belt One Road infrastructure building initiative.
While the Chinese plans are a welcome step in the right direction for the mining industry, they will be insufficient for a meaningful impact on its cyclical condition.
Estimates of US$150 billion of annual expenditure will be equivalent to only 0.2% of global GDP and 0.8% of currently depressed global investment.
The Chinese initiated expenditure - if it reaches as much as the amounts currently anticipated - will still fall short of compensating for the fall in investment over the past two years.


