The Current View
Growth in demand for raw materials peaked in late 2010. Since then, supply growth has continued to outstrip demand leading to inventory rebuilding or spare production capacity. With the risk of shortages greatly reduced, prices have lost their risk premia and are tending toward marginal production costs to rebalance markets.
To move to the next phase of the cycle, an acceleration in global output growth will be required to boost raw material demand by enough to stabilise metal inventories or utilise excess capacity.
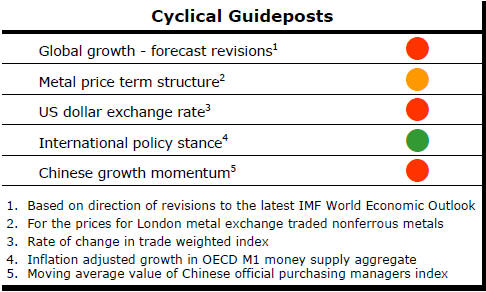
The PortfolioDirect cyclical
guideposts suggest that the best possible macroeconomic circumstances for
the resources sector will involve a sequence of upward revisions to
global growth forecasts, the term structure of metal prices once again
reflecting rising near term shortages, a weakening US dollar, strong money
supply growth rates and positive Chinese growth momentum. Only one of
the five guideposts is "set to green" suggesting the sector remains confined
to the bottom of the cycle .
Has Anything Changed? - Updated View
Since mid 2014, the metal market cyclical position has been characterised as ‘Trough Entry’ as prices have remained in downtrend with all but one of the PortfolioDirect cyclical guideposts - the international policy stance - flashing ‘red’ to indicate the absence of support.
The absence of a global growth acceleration, a stronger dollar and flagging Chinese growth momentum remain critical features of the current cyclical positioning.
Through February 2016, the first signs of cyclical improvement in nearly two years started to emerge. After 15 months of contango, the metal price term structure shifted to backwardation reflecting some moderate tightening in market conditions.
The metal price term structure is the most sensitive of the five cyclical guideposts to short term conditions and could, consequently, quickly reverse direction. Nonetheless, this is an improvement in market conditions and the guidepost indicator has been upgraded to ‘amber’ pending confirmation of further movement in this direction.
Monetary Policies to Dictate Mining Investment
Outcomes
Central banks are poised to retain unusually powerful roles in mining sector
investment outcomes.
Central bank monetary policies have always been a contributing influence on resource sector investment returns but rarely have they played such a dominant or long lasting role.
With declining productivity and adverse demographics hobbling an improvement in global growth momentum, resource sector prices have become increasingly bound to global monetary conditions.
China is moving through a well documented economic transition which can only succeed with a slower growth outcome and less dependence on raw material consuming industries.
Similarly, in other developing market economies like India, Brazil and Russia, peculiar structural and institutional impediments constrain growth in each.
In the USA, where growth appears more robust than anywhere else, structural impediments to something better are also evident.
The macro picture continues to reflect a world with insufficient output growth momentum to support a cyclical improvement in raw material demand.
The positive liquidity effects from low interest rate and quantitative easing policies in the USA, Europe and Japan have had an impact on asset prices but have largely failed to support higher rates of output growth, the critical ingredient in mining industry prosperity.
This should come as no surprise. Monetary policy operates most directly on asset prices. The timing and magnitude of any impact on growth is secondary and typically unpredictable.
Proponents of central bank action will argue that growth outcomes will have been so much worse without their efforts to shore up financial sector liquidity flows.
Others will assert just as vehemently that central banks are creating decades-long distortions which will underpin a future financial calamity.
In either event, the mining industry’s first priority, namely, a recovery in global output growth rates is not a primary goal presently as reflation, financial institution stability and exchange rates loom larger as policy targets.
Exchange rates are among the more important variables affecting mining investment outcomes on which central banks may have an influence.
The 26% rise in the U.S. dollar between July 2014 and March 2015, measured against a basket of major trading partner currencies, coincided with an 18% decline in metal prices which had already fallen by over 40% as the growth outlook deteriorated.
The dollar has only retreated slightly from its most elevated levels and, for well over a year, has remained within a relatively narrow 7% price range.
Conventional wisdom had suggested a continuing upward bias in the currency during 2016 as U.S. interest rate normalisation policies ran their course and as interest rates were lowered elsewhere to reflect growth differences.
T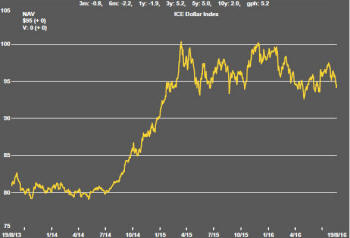 hose
expectations of diverging policies have not been realised leaving the U.S.
dollar more prone than ever to suffer day-to-day sentiment swings.
hose
expectations of diverging policies have not been realised leaving the U.S.
dollar more prone than ever to suffer day-to-day sentiment swings.
Traders who use ICE dollar futures to take a directional view are now being influenced by the repeated attempts of the dollar index to test the lower bound of its 18 month trading range leaving them increasingly prepared to fund a potentially lengthy downward break.
The mining industry would receive a fillip from such an eventuality with metal prices generally benefiting from a U.S. dollar trading lower.
Such a move would not come without some risk of market disruption. A lower U.S. dollar implies currency appreciation among a range of countries already struggling to improve their growth rates and relying on the international competitiveness of their exports for an additional boost.
The extent of dollar weakness, and the related prospects for mining industry investments, will depend on how aggressively central banks outside the USA pursue improvements in national competitiveness through their currencies.
While global growth has been disappointingly slow during 2016, market conditions have appeared welcomely benign without more crises of the type which had peppered markets in the past several years. The latest of these, the feared impact of a vote by the UK to leave the European Union, proved short-lived and quickly forgotten.
The mining industry has benefited from a widespread risk reappraisal within financial markets. Emerging market equity prices have risen 32% since late January 2016. High yield corporate bond prices have gone up 18%. Government bond yields are unprecedentedly low and, in some instances, negative.
Consistent with this broad based re-pricing of risky assets, the Euromoney and S&P/TSX global mining indices have risen 99% and 75%, respectively, after having turned within a day of the broader indicators of risk appetite.
In Australia, the large cap resources sector index dominated by BHP Billiton and Rio Tinto has risen 45% since January while the mid-cap resources index with more leverage to changing sentiment has added 84%.
These swings tempt talk of a sector recovery. The improved prices are a welcome respite, no doubt, but the ‘recovery’, such as it is, has merely returned sector prices to where they had been in the first half of 2015, perceived at the time as a period of intense historical weakness.
The greater tolerance for risk evident across a broad range of markets depends heavily on a belief that central banks will sustain their liquidity lifeblood.
The inflation adjusted growth rate in OECD money (M1) supply has been in the 8-11% p.a. range for 18 months and consequently among the strongest growth rates over the past 50 years.
Such stimulus would once have been enough to support stronger metal prices as the combination of inflation impetus, liquidity flows funding speculation and lagged growth effects had an impact.
Currently, liquidity flows are supporting speculative activity without the benefit of these other forces contributing to cyclical progress.
Against this background, the mining industry faces what could be characterised as a growthless cycle in which returns are dominated by the effects of central banks working feverishly to sustain risk tolerance through a constantly growing liquidity stream. This, on its own, is a flimsy base for the industry’s future prosperity. .