The Current View
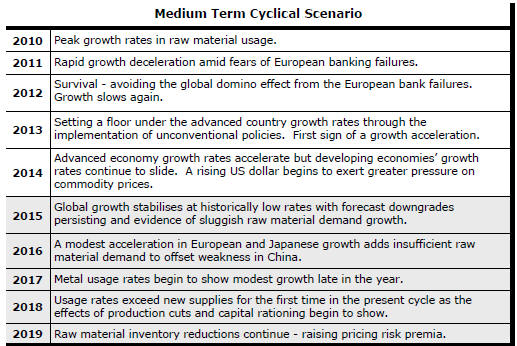
Growth in demand for raw materials peaked in late 2010. Since then, supply growth has generally outstripped demand leading to inventory rebuilding or spare production capacity. With the risk of shortages greatly reduced, prices lost their risk premia and have been tending toward marginal production costs to rebalance markets.
The missing ingredient for a move to the next phase of the cycle is an acceleration in global output growth which boosts raw material demand by enough to stabilise metal inventories or utilise excess capacity.
The PortfolioDirect cyclical
guideposts suggest that the best possible macroeconomic circumstances for
the resources sector will involve a sequence of upward revisions to
global growth forecasts, the term structure of metal prices once again
reflecting rising near term shortages, a weakening US dollar, strong money
supply growth rates and positive Chinese growth momentum. None of the five guideposts is "set to green"
(after the most recent adjustments in December 2016) suggesting the sector remains confined
to near the bottom of the cycle.

Has Anything Changed? - Updated View
From mid 2014, the metal market cyclical position was characterised as ‘Trough Entry’ with all but one of the PortfolioDirect cyclical guideposts - the international policy stance - flashing ‘red’ to indicate the absence of support.
Through February 2016, the first signs of cyclical improvement in nearly two years started to emerge. The metal price term structure reflected some moderate tightening in market conditions and the guidepost indicator was upgraded to ‘amber’ pending confirmation of further movement in this direction.
As of early December 2016, the Chinese growth momentum indicator was also upgraded to amber reflecting some slight improvement in the reading from the manufacturing sector purchasing managers index. Offsetting this benefit, to some extent, the policy stance indicator has been downgraded from red to amber. While monetary conditions remain broadly supportive, the momentum of growth in money supply is slackening while further constraints on fiscal, regulatory and trade regimes become evident.
IMF Stops Growth Downgrades
The International Monetary Fund has stopped downgrading its
global growth forecasts. It has not yet moved into the next stage of
the cycle with the commencement of upward revisions but, at least, it has
stopped the downgrades.
Last week, the IMF left its forecasts for global growth in 2017 and 2018 unchanged at 3.4% and 3.6%, respectively.
Slight upgrades to advanced economy growth rates of 0.1
percentage points and a 0.2 percentage points were offset by a cut of 0.1
percentage points in emerging market growth prospects.

Within the advanced economies, expected growth in Europe (notably in Italy and the UK) is expected to be offset by better outcomes in the USA than thought likely in October when the IMF completed its last full-scale outlook review .
Among the developing economies, India is expected to grow less strongly in the near term following implementation of currency reforms designed to crack down on the cash economy. The Fund expects a recovery once these changes are bedded down.
Reflecting some improvement in output indicators in the middle of 2016, Chinese growth is expected to be slightly higher than previously anticipated.
While no change to the headline outcome is good news against a lengthy history of forecasts and downgrades over recent years, the IMF has characterised the balance of risks as still tilted to the downside.
In framing its forecasts, the Fund is anticipating some form of fiscal expansion in the USA with the House of Representatives, Senate and presidency coming under Republican Party control, although the precise form of foreshadowed policy changes remain unknown.
The Fund has modified its growth estimate for the USA to take account of what it believes are feasible policy options.
The resulting U.S. growth boost of only 0.4 percentage points for an outcome of 2.5% in 2018 appears well short of the election trail rhetoric about getting growth closer to 4%.
Based on the assessment of U.S. growth prospects implicit in the IMF forecast revisions, markets may be prone to disappointment in the coming year or two.
The IMF may simply be too pessimistic about the Trump-led growth effect on the USA just as it was in its assessment of the Brexit impact on UK growth. The Fund has had to add back 0.4 percentage points to UK growth in 2017 although it has cut back its 2018 forecast to take account of a delayed Brexit effect.
From a resources sector standpoint, the growth picture painted by the Fund is consistent with moving along the bottom of a cyclical trough.
The debilitating impact of growth downgrades on expectations has passed but there is not yet enough evidence for confidence about the likelihood of a cyclical upturn.
A key ingredient of any cyclical upturn - an acceleration in global growth - is technically present insofar as the Fund is expecting growth in 2018 to exceed growth in 2017 but the difference in outcomes is hardly material.
Realisation of such a minor acceleration in growth places a cap on the potential growth in raw material usage rates and limits the extent to which inventories can decline, if at all with less easily modified supplies tracking higher.


