The Current View
Growth in demand for raw materials peaked in late 2010. Since then, supply growth has continued to outstrip demand leading to inventory rebuilding or spare production capacity. With the risk of shortages greatly reduced, prices have lost their risk premia and are tending toward marginal production costs to rebalance markets.
To move to the next phase of the cycle, an acceleration in global output growth will be required to boost raw material demand by enough to stabilise metal inventories or utilise excess capacity.
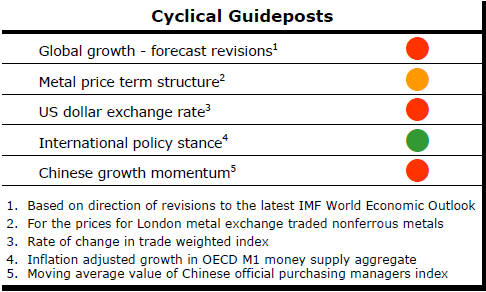
The PortfolioDirect cyclical
guideposts suggest that the best possible macroeconomic circumstances for
the resources sector will involve a sequence of upward revisions to
global growth forecasts, the term structure of metal prices once again
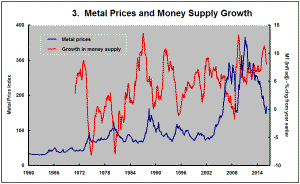
reflecting rising near term shortages, a weakening US dollar, strong money
supply growth rates and positive Chinese growth momentum. Only one of
the five guideposts is "set to green" suggesting the sector remains confined
to the bottom of the cycle .
Has Anything Changed? - Updated View
Since mid 2014, the metal market cyclical position has been characterised as ‘Trough Entry’ as prices have remained in downtrend with all but one of the PortfolioDirect cyclical guideposts - the international policy stance - flashing ‘red’ to indicate the absence of support.
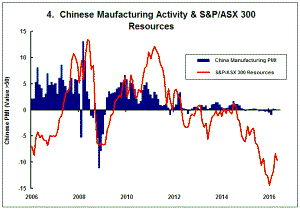
The absence of a global growth acceleration, a stronger dollar and flagging Chinese growth momentum remain critical features of the current cyclical positioning.
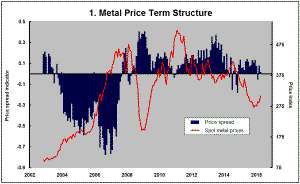
Through February 2016, the first signs of cyclical improvement in nearly two years started to emerge. After 15 months of contango, the metal price term structure shifted to backwardation reflecting some moderate tightening in market conditions.
The metal price term structure is the most sensitive of the five cyclical guideposts to short term conditions and could, consequently, quickly reverse direction. Nonetheless, this is an improvement in market conditions and the guidepost indicator has been upgraded to ‘amber’ pending confirmation of further movement in this direction.
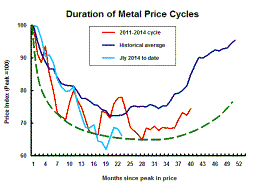
Metal Price Gains Fizzle Out
Strengthening commodity prices which had created some excitement since the
beginning of 2016 over the prospect of an improving price cycle - at last -
have fizzled out during May.
Prices appear to be approaching a cyclical trough but the current metal price positioning remains very weak by historical standards.
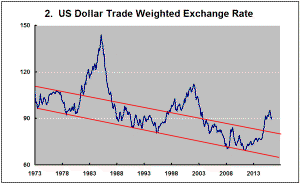
Exchange rate movements have been crucial to the changing direction of metal prices.
The rise in metal prices through the first months of 2016 coincided with the beginning of a retracement in the U.S. dollar which had been on a rising trend since mid 2014.
The modest U.S. dollar reversal reflected changed expectations about the tempo of U.S. interest rate increases in the face of a slowing US growth momentum.
More recently, comments from Federal Reserve governors have stoked expectations of a more rapid rise than had been expected earlier in the year with a consequential impact on the exchange rate.
Exchange rate movements are likely to remain the single most important influence on metal prices in the absence of fresh global growth momentum.
US Households and Business Face Growth
Differences
The search for the economic momentum capable of driving higher metal usage
rates is proving remarkably fruitless.
In the USA, a surge in growth now appears under way but this is only striking because of the loss of momentum over the previous three quarters. Without that, growth would look as anemic as ever.
The chart offers one illustration of what has been happening within the U.S. economy. Consumers and business have been traveling at different speeds.
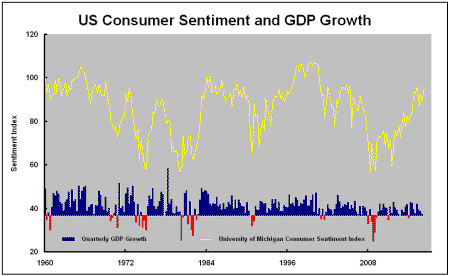
Consumer sentiment (shown in the yellow line) has been tending higher (although not without some hesitancy) but GDP growth has been heading in the opposite direction to the point that, at 0.1% for the March quarter, it was barely positive.
The consumer sentiment data reflect those factors most immediately affecting households such as employment, wages and inflation.
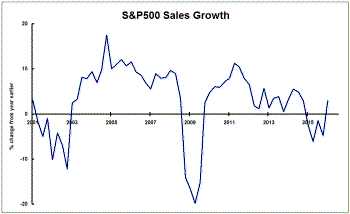
Meanwhile, companies have faced a decline in sales consistent with what has been experienced in previous times during a full-blown recession.
A strong U.S. dollar and slow international growth have affected business sales adversely. Weak oil prices caused reduced spending on capital goods and industry services by producers.
Some of these latter influences have begun to turn. The dollar has stopped falling, for example, and oil prices have risen.
 Whether
either move is sustainable remains uncertain. Presently, the big macro
forces like Greek debt default and a Chinese financial crisis are less
influential. The world seems more benign than it might have been a year
ago, for example, although that could change as the vote on the UK exiting
the European Union draws closer.
Whether
either move is sustainable remains uncertain. Presently, the big macro
forces like Greek debt default and a Chinese financial crisis are less
influential. The world seems more benign than it might have been a year
ago, for example, although that could change as the vote on the UK exiting
the European Union draws closer.
The implication for global raw material markets of these changes is that relatively short term movements in financial market expectations have become the principal influences on metal prices in the absence of any meaningful improvement in growth momentum.
As long as that is the case, it will be tempting but difficult to talk about recovery or cyclical improvement. remains unclear.