The Current View
Growth in demand for raw materials peaked in late 2010. Since then, supply growth has generally outstripped demand leading to inventory rebuilding or spare production capacity. With the risk of shortages greatly reduced, prices lost their risk premia and have been tending toward marginal production costs to rebalance markets.
The missing ingredient for a move to the next phase of the cycle is an acceleration in global output growth which boosts raw material demand by enough to stabilise metal inventories or utilise excess capacity.
The PortfolioDirect cyclical
guideposts suggest that the best possible macroeconomic circumstances for
the resources sector will involve a sequence of upward revisions to
global growth forecasts, the term structure of metal prices once again
reflecting rising near term shortages, a weakening US dollar, strong money
supply growth rates and positive Chinese growth momentum. Only one of the five guideposts is "set to green"
(after the most recent adjustments in July 2017) suggesting the sector remains confined
to near the bottom of the cycle.

Has Anything Changed? - Updated View
From mid 2014, the metal market cyclical position was characterised as ‘Trough Entry’ with all but one of the PortfolioDirect cyclical guideposts - the international policy stance - flashing ‘red’ to indicate the absence of support.
Through February 2016, the first signs of cyclical improvement in nearly two years started to emerge. The metal price term structure reflected some moderate tightening in market conditions and the guidepost indicator was upgraded to ‘amber’ pending confirmation of further movement in this direction.
As of early December 2016, the Chinese growth momentum indicator was also upgraded to amber reflecting some slight improvement in the reading from the manufacturing sector purchasing managers index. Offsetting this benefit, to some extent, the policy stance indicator was been downgraded from green to amber.
The most recent change in cyclical guidepost positioning has been at the end of July 2017 when the exchange rate guidepost was upgraded to green.
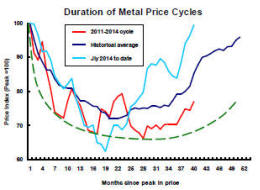
Cyclical Position
Thirty seven months after their peak, metal prices should have passed their nadir and be heading higher, as they are.
Time, of itself, is not important but the sequence of adjustments which contribute to higher prices and changed expectations takes time.
Currently, prices are running ahead of average historical outcomes suggesting scope exists for a pullback closer to the average outcomes over the past 60 years.
A pullback is not a necessary outcome but an alternative result would most likely require some combination of higher growth, further U.S. dollar weakness or a period of more supportive monetary policies.
There is no assurance presently that any of those three factors will favour the cycle progressing significantly beyond its present position.
The balance of risks suggests a more moderate appreciation in metal prices.
Global Growth - Forecast Revisions
Improved mining industry fortunes now depend on Donald Trump skilfully husbanding tax cuts through the US Congress, Theresa May adeptly negotiating a favourable Brexit pact and Xi Jinping cutting back runaway lending while sustaining Chinese growth. What’s the chance?
The International Monetary Fund released its half yearly World Economic Outlook this month to coincide with the world’s finance ministers gathering in Washington.
The Fund’s upgrade of the global growth outlook
ostensibly contained some of the best news for the mining industry since
2010.

Movements in raw material demand are closely tied to world growth and, more particularly, to the momentum of growth. The strongest increases in metal usage typically occur when global GDP growth is accelerating.
Rising growth projections are usually a positive sign for the mining sector. It offers strategists firmer analytical grounds for raising sectoral fund allocations.
The IMF announced on 10 October that it had raised its forecast for global growth in 2017 to 3.6% from 3.4% at the time of the corresponding forecast round last year and after a 3.2% expansion of the global economy in 2016. The change for 2017 - the largest upgrade since an initial forecast of 4.5% in 2013 - follows a succession of negative revisions.
The good news is that the macroeconomic risk profile has shifted significantly in favour of the mining industry.
The not so good news is that 2017 is nearly as good as it gets, in the eyes of the Fund. The positive momentum on which strengthening growth in raw material demand relies is almost nonexistent.
Among the advanced economies, growth by 2022 is expected to be 0.5 percentage points lower than in 2017 as economic slack is eliminated. Chinese growth is expected to decline by a full percentage point.
Any global growth improvement is expected to come entirely from emerging market economies outside China in Latin America, the Middle East and sub-Saharan Africa.
The most egregious risks have been eliminated but the forecasts imply growth in metal demand running below historical averages.
Of course, the IMF may be wrong. Having overestimated growth earlier in the cycle, forecasting conservatism might now be forcing errors in the opposite direction.
Despite the IMF’s impressive analytical firepower, its latest forecasts might have also been compromised by subtle political pressures.
Maurice Obstfeld, the Fund’s head of research, inadvertently let the cat out of the bag when briefing the press about the Fund’s views.
Pushed by journalists to opine on policy settings and likely outcomes in the UK, the USA and China, Obstfeld was uncomfortably circumspect as he sought to avoid saying anything newsworthy about these prominent Fund members.
Obstfeld knows that tax changes in the USA, post-Brexit policy in the UK and how China restores control over an obviously unsustainable flood of liquidity will prove critical in framing economic outcomes over the coming five years.
Most often, assuming an unchanged policy mix, or an average of recent outcomes, is a reasonable enough working assumption on which to base medium term forecasts. In this instance, Europe, the USA and China are on the edge of directional shifts in growth as potentially momentous policy predicaments coincide.
Trump and Republican Party members in the US Congress offer the greatest chance of upside surprise. With less than 30 days left in this year’s House of Representatives calendar, we will know shortly whether they can take advantage of the opportunity.
Earlier in the year, the Fund had been prepared to give the new Trump administration the benefit of the doubt in framing its view about the future course of fiscal policy. The Fund upped its forecasts in anticipation of higher infrastructure spending, lower taxes and less burdensome regulation.
Since then, as even members of the majority Republican Party have downscaled their legislative ambitions, the Fund has backtracked to a, possibly optimistic, ‘wait and see’ position.
Realistically, Europe, China and the USA could all come up with something worse than what is implied by the middle of the road assumptions the IMF is currently contemplating as its base.
In Europe, Brexit looms. The Fund’s assumption of growth drifting back due to weak productivity and unfavourable demographics optimistically ignores the possibility of growth slumping badly in the event disrupted trade patterns and supply chains retard business investment.
Brexit may yet prove advantageous for Europe and Britain but negotiations in the next few weeks will have to take a turn for the better if that possibility is to be realised.
China’s policymakers have repeatedly baulked at remedying the country’s long recognised reliance on loose lending policy settings to propel investment. While the higher growth has cheered investors, systemic risks have multiplied.
Obstfeld diplomatically credited the leadership with recognising the problem while conceding the obvious unsustainability of China’s monetary policies.
Some commentators have speculated that Xi Jinping has avoided putting his growth target at risk leading up to the communist party congress this month where his anointment as possibly the most dominant national leader since Deng Xiaoping or Mao Zedong himself has been expected.
With party secretary Xi feeling more politically secure, action over the next two years looms larger as Chinese authorities face one of the biggest tests of their abilities in 20 years.
Chinese policymakers may well prove superior economic managers than their western counterparts but higher growth will be an accident. Success means moderately lower, albeit surer, Chinese growth. Failure will be a sharp descent as lending is restricted.
Recent metal price strength has reflected modest improvements in growth outcomes helped along by extraordinarily cheap money and a US dollar decline of as much as 12% against its major trading partners.
As some of the most favourable monetary conditions in modern history are wound back, the mining industry will be relying more heavily on output growth and, for that, on the policy dexterity of Messrs Trump, Xi and May.
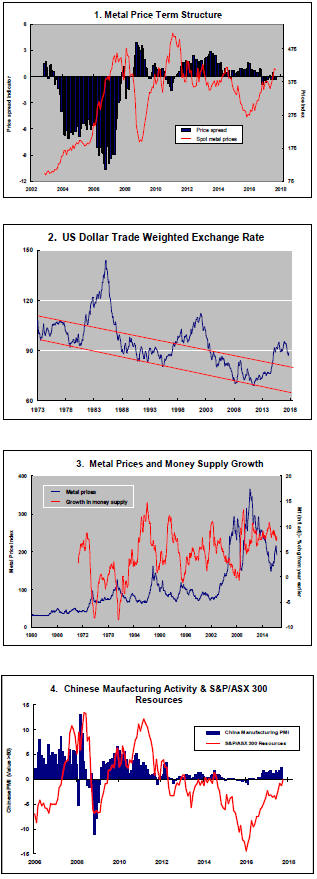
US Dollar Exchange Rate - Chart 2
Much of the recent upward trajectory in metal prices has been contributed by a weaker U.S. dollar.
The currency adjustment has reflected some reappraisal of relative growth rates and the direction and pace of interest rate changes.
In particular, a rethink has occurred about the length of the lag between the U.S. Federal Reserve beginning to tighten its monetary policies and the European Central Bank going down the same path.
Expectations having been reset, a need for further changes in the exchange rate have probably receded.
With the prospect of a fiscal filip to the U.S. economy in 2018 and 2019 from tax cuts, a move higher in the U.S. dollar appears to have now become a stronger possibility - at least for the time being.
Once the legislative process gets underway more fully and two or three Republican senators express doubts about giving it their support, this possibility could quickly reverse.
International Policy Stance - Chart 3
Global monetary policies had been set to support higher asset prices as a step toward raising demand and creating stronger employment markets.
While the emphasis on these policies is being reduced as growth becomes more self sustaining, monetary accommodation remains historically strong.
Metal prices are affected by monetary conditions with a lag of several quarters so that there is no imminent threat from a winding back in monetary conditions but the prospective trajectory of monetary policy will be a source of eventual downward pressure on metal prices.
Metal Price Term Structure - Chart 1
Some modest tightening in nonferrous metal price spreads has been occurring over the past three months driven by emerging backwardations in London Metal Exchange lead and zinc prices.
The tightening in spreads is modest by the standards of what might be possible but overall physical market balances do not appear to be changing enough for the shift in premiums to move more dramatically.
The International Copper Study Group (ICSG) has reported that demand for the metal in the six months to June 2017 was 2.1% below the level of use over the corresponding period of 2016.
The ICSG has estimated that there was a 214,000 tonne increase in global metal inventories between the end of June 2016 and the end of June 2017.
The International Lead Zinc Study group has reported that zinc usage in the first eight months of 2017 increased by only 0.6%, well below the 3%+ historical rates of zinc consumption growth.
The unusually weak expansion in zinc usage has coincided with static metal production after mine output fell in 2016. The changing production profile has helped constrain the inventory build that might have otherwise occurred but mine output has again begun to outstrip consumption growth rates.
With only moderately increasing or falling rates of usage across the major daily traded metals, relatively narrow metal price spreads may indicate market conditions are insufficiently strong to carry the cycle significantly further.
Chinese Growth Momentum - Chart 4
After China reported a modestly expanding manufacturing sector during September, it estimated GDP growth in the September quarter was 1.7% taking the expansion in GDP over the year to September 2017 to 6.9%.
Resource sector equity prices remain understandably
responsive to changes in Chinese activity, given the country's disproportionate
share of global metal consumption.
While the current strength of Chinese raw material demand is a welcome sign for the industry, further gains remain highly dependent on the accommodative lending policies of the central government.
The dependence on financial leverage comes despite widespread agreement that the flow of funds is unsustainable and creating longer term distortions which will need addressing.
Suggestions of ‘good’ economic outcomes being contrived in the lead-up to the national congress of the Chinese communist party this month are based on signs of Xi Jinping wishing to consolidate his position as preeminent leader of the country.
Once the politics is out of the way and the central committee can focus more fully on longer term economic issues, cyclical risks for raw material markets are more likely to be biased to the downside.