The Current View
Growth in demand for raw materials peaked in late 2010. Since then, supply growth has continued to outstrip demand leading to inventory rebuilding or spare production capacity. With the risk of shortages greatly reduced, prices have lost their risk premia and are tending toward marginal production costs to rebalance markets.
To move to the next phase of the cycle, an acceleration in global output growth will be required to boost raw material demand by enough to stabilise metal inventories or utilise excess capacity.
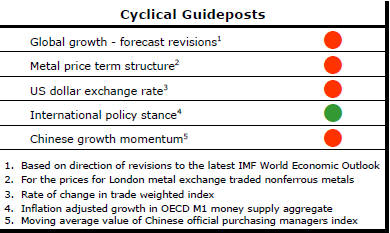
The PortfolioDirect cyclical
guideposts suggest that the best possible macroeconomic circumstances for
the resources sector will involve a sequence of upward revisions to
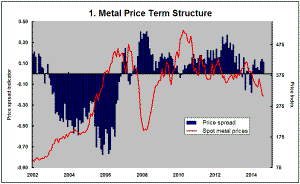
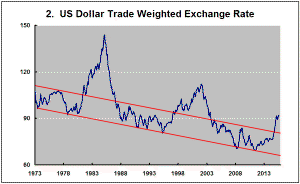
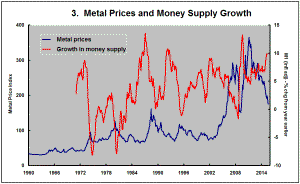
global growth forecasts, the term structure of metal prices once again
reflecting rising near term shortages, a weakening US dollar, strong money
supply growth rates and positive Chinese growth momentum. Only one of
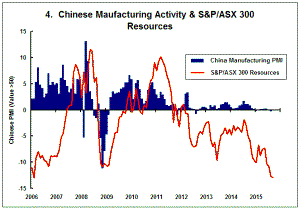
the five guideposts is "set to green" suggesting the sector remains confined
to the bottom of the cycle .
Has Anything Changed?
Throughout 2014, PortfolioDirect had been characterising the cyclical position as ’Trough Entry’ with some expectation that by the end of 2014 an exit would be evident. Until very late in the year, the evidence supported that possibility before conditions took several backward steps.
The absence of a growth acceleration among the major economic regions is contributing to the flagging momentum. A stronger US dollar is also imparting a downward bias to US dollar denominated prices presently.
This change has been enough to define a fresh cycle and a more prolonged adjustment process.
A Revised Cyclical Positioning
The post-2011 cyclical adjustment has given way to a period of intensified
cyclical weakness accompanied by slowing growth in raw material demand and a
strengthening U.S. dollar.
Since 2011, PortfolioDirect has been describing the cyclical positioning of raw material markets as “trough entry” in the expectation of a conventional market balancing process which, over several years, would lead to greater stability in commodity prices before setting the scene for the “trough exit” phase of the cycle.
The PortfolioDirect modelling uses progress along this adjustment path as a primary guidepost to market riskiness and funds allocation to individual industry segments.
Until mid 2014, the process of adjustment had been broadly consistent with historical patterns leading to some expectation that sector markets would become progressively more attractive toward the latter part of 2014 and the earlier months of 2015.
The uplift in the U.S. dollar in the third quarter of 2014 took some steam from that process. A definite step down in prices which has persisted for some 12 months has coincided almost exactly with the currency move.
The forces contributing to a stronger U.S. dollar remain more powerful than those operating in the opposite direction. Added to that, the flow of physical usage statistics so far in 2015 has shown a marked slowing in global activity.
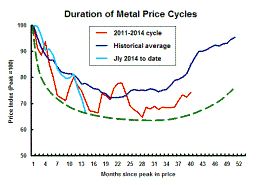
While any sign of recovery after 2011 had been slight and among the weakest cycles in the past 50 years, a clear demarcation in conditions is now evident prior to and after July 2014. PortfolioDirect has taken this as the beginning of a fresh cycle with the accompanying need for a rejuvenated adjustment process.
In the adjacent “Duration of Metal Price Cycles” illustration, this post-2014 cycle is shown in cyan (with the 2011-2014 cycle depicted in red).
The clearest consequence of this conclusion is on the timing of an eventual cyclical upturn. It will have been delayed by some months. On average, from this point, another 25-30 months would normally have to elapse to get market balances back to their mid 2014 positioning.
The PortfolioDirect funds allocation to the sector as a whole and within the Phase I-IV component parts would be correspondingly affected. On the modelling used, an uplift in equity funds committed to the sector would not be warranted until late 2016.
The duration of cycles varies and conditions may change more or less speedily than implied by the historical averages. The technical equity and commodity market indicators used by PortfolioDirect will give some short term guidance to likely deviations from the norm. At this stage, however, most of the key signs are negative with the macro landscape forming an unfavorable scenario for investment in the sector.
The allocations across the three development phases around which the portfolio models are structured already reflect this cyclical positioning.
Relatively strong market conditions for those largest stocks able to offer a sense of safety from their ability to transcend cycles due to the size of their operations and balance sheet capacity are likely to persist.
The more development oriented companies whose access to capital dictates progress are likely to face intensifying negative pressures. Demonstrable access to innovative sources of capital will distinguish companies in this part of the market which, in any event, are likely to find capital scarce and expensive. Project funding is likely to occur increasingly at the expense of early stage investors whose returns are likely to be well below their cost of capital for the foreseeable future.
In this environment, the PortfolioDirect recommendations had included increasingly large holdings of cash for the past several months as the technical indicators had pointed to prolonged market weakness. As a result, there have been no radical changes to the portfolio models being presented or to cash allocations as a direct result of this reappraisal of the cyclical positioning of the industry.