The Current View
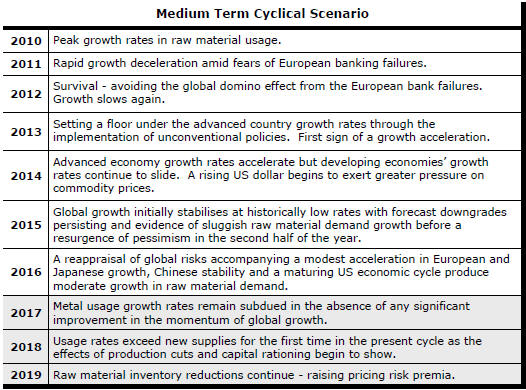
Growth in demand for raw materials peaked in late 2010. Since then, supply growth has generally outstripped demand leading to inventory rebuilding or spare production capacity. With the risk of shortages greatly reduced, prices lost their risk premia and have been tending toward marginal production costs to rebalance markets.
The missing ingredient for a move to the next phase of the cycle is an acceleration in global output growth which boosts raw material demand by enough to stabilise metal inventories or utilise excess capacity.
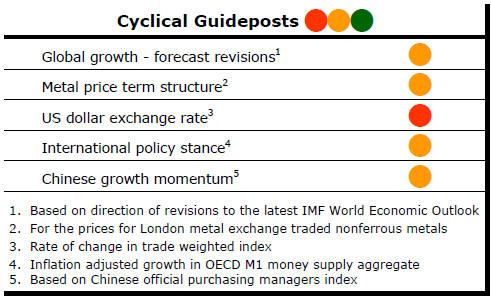
The PortfolioDirect cyclical
guideposts suggest that the best possible macroeconomic circumstances for
the resources sector will involve a sequence of upward revisions to
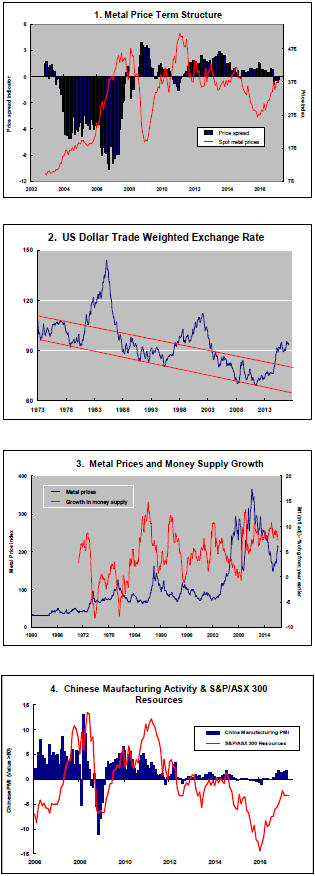
global growth forecasts, the term structure of metal prices once again
reflecting rising near term shortages, a weakening US dollar, strong money
supply growth rates and positive Chinese growth momentum. None of the five guideposts is "set to green"
(after the most recent adjustments in December 2016) suggesting the sector remains confined
to near the bottom of the cycle.
Has Anything Changed? - Updated View
From mid 2014, the metal market cyclical position was characterised as ‘Trough Entry’ with all but one of the PortfolioDirect cyclical guideposts - the international policy stance - flashing ‘red’ to indicate the absence of support.
Through February 2016, the first signs of cyclical improvement in nearly two years started to emerge. The metal price term structure reflected some moderate tightening in market conditions and the guidepost indicator was upgraded to ‘amber’ pending confirmation of further movement in this direction.
As of early December 2016, the Chinese growth momentum indicator was also upgraded to amber reflecting some slight improvement in the reading from the manufacturing sector purchasing managers index. Offsetting this benefit, to some extent, the policy stance indicator has been downgraded from green to amber. While monetary conditions remain broadly supportive, the momentum of growth in money supply is slackening while further constraints on fiscal, regulatory and trade regimes become evident.
IMF Begin Growth Upgrades - Just
The International Monetary Fund (IMF) has upgraded its global growth
forecast for 2017 in its April World Economic Outlook entitled “Gaining
Momentum?”.
The IMF now expects world growth to rise from 3.1% in 2016 to 3.5% in 2017 and 3.6% in 2018.
Any upgrade is welcome but the extent of the change is quite modest. Growth in 2017 has been raised by 0.1 percentage point and the 2018 forecast has been left unchanged.
The upgrade is more modest than even this appears. In
October 2016, the forecast for 2017 was actually 3.44%. The revised forecast
for this year of 3.46% is barely different. The 0.1 percentage point
difference is due primarily to propitious rounding. 
Ironically, far larger upgrades occurred to historical growth estimates for 2013, 2014 and 2015 suggesting that any suggested prospective improvements are well within the range of estimation errors.
Beyond 2018 - in 2019, 2020 and 2021 - forecast growth has actually been lowered slightly suggesting the world economy remains awkwardly positioned as it fights the still considerable headwinds preventing it breaking significantly above 3.5%.
In the absence of a meaningful acceleration in growth, stronger raw material demand growth remains hard to foresee. Usage rates are consequently set to remain within range of available supplies, dampening the prospect of progress toward another cyclical upturn.
Within the overall growth forecast, the biggest upgrade in 2017 - 0.9 percentage points - was for growth in the United Kingdom. The adverse impact of a pro-Brexit vote was overestimated by economists who generally supported the UK staying in the European Union and may have erred in extrapolating their own anxieties onto the population at large who viewed the vote far more favorably.
Japanese and Spanish growth forecasts also benefited from positive reappraisals with gains of 0.6 and 0.4 percentage points, respectively.
Growth was once again downgraded in emerging markets and developing economies.
Big cuts were made to growth in Saudi Arabia (down 1.6 percentage points), Mexico (-0.6 points), India (-0.4) and Brazil (-0.3).
Anticipated growth in world trade volumes in 2018 were cut back by 0.3 percentage points pushing growth to 3.8% and 3.9% in 2017 and 2018, respectively, after a 2.2% expansion in 2016.
The mindset of forecasters has moved toward a 3.5% base case from their prior starting position of 4% or better from which subsequent downgrades arose.
The lower base is more consistent with the most recent experience, evident declines in productivity and structural impediments in the main economic regions such as the USA, Europe, Japan and China which would normally have to carry the burden of initiating stronger activity.
The risk for forecasters now - consistent with the historical risk they have faced in accurately predicting changes in the pace of growth - is that they become too wedded to the new mindset and insufficiently nimble to anticipate a possible acceleration on the horizon.
The first of the five PortfolioDirect cyclical guideposts described above is designed to take account of where forecasters are currently positioned in the sequence of growth revisions and, consequently, the likelihood of a positive growth surprise.
Technically, growth has been upgraded and more suggestive of upside surprise but the change is barely more than a statistical sliver in the scheme of things and not yet enough to say that cyclical progress has been speeded up meaningfully.
Chinese Growth Slows
China reported that its economy grew by 6.9% over the year ended March.
The China growth picture is more complicated than suggested by the headline 6.9% number, which has been described by some as a positive surprise.
The Chinese government publishes its quarterly GDP statistics an amazingly short time after the end of the quarter they are intended to measure causing many analysts to doubt the quality of the statistics and for some to even suspect deceit or manipulation.
Questions of honesty aside, the Chinese speed up
reporting by using far smaller samples than would be used in advanced
economies and by offering much less detail in their national accounts
reports.
The chart shows Chinese GDP growth from the previous quarter, as reported in the officials statistics, as distinct from the corresponding quarter a year earlier.
The quarterly growth pattern shows a loss of momentum leading to a March quarter outcome among the lowest in the past seven years.
The Chinese economy grew by 1.3% in the March quarter or at a 5.3% annualised rate implying an outcome significantly below those in the second half of 2016.
Evidence from a range of sources points to a resurgence of Chinese growth since mid- 2016. The survey of manufacturing purchasing managers shown in the fourth chart in the right hand panel is one such an indicator. Consistent with this picture of heightened economic activity are the improved metal market conditions reflected in higher prices.
Unfortunately - and despite some commentaries to the contrary - the latest Chinese statistics are suggesting a slackening of these pressures and not a buildup which might result in an acceleration in economic activity.
Against this background, the necessary cyclical support from an improvement in growth momentum appears lacking.