The Current View
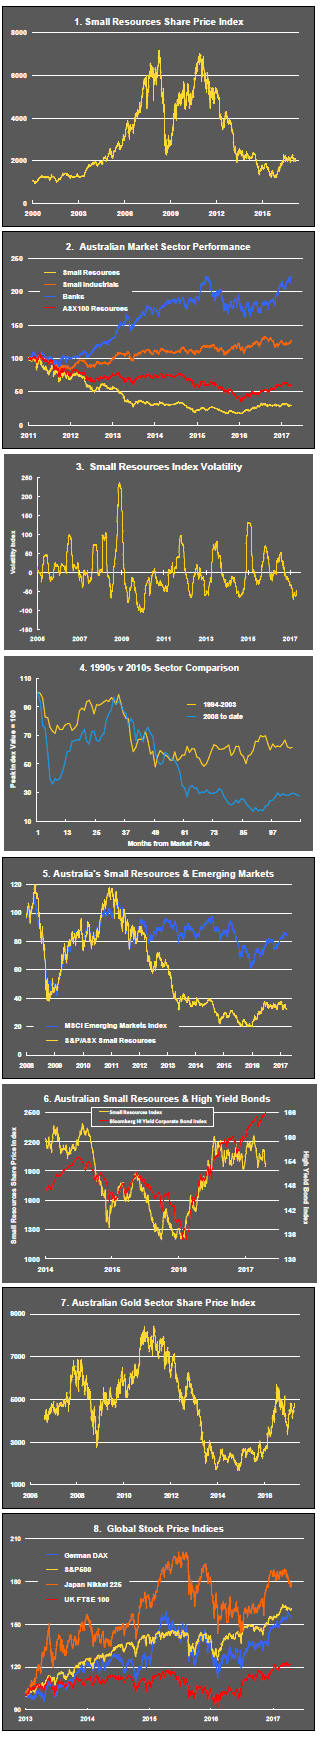
A lengthy downtrend in sector prices had given way to a relatively stable trajectory after mid 2013 similar to that experienced in the latter part of the 1990s and first few years of the 2000s.
The late 1990s and early 2000s was a period of macroeconomic upheaval during which time sector pricing nonetheless proved relatively stable.
Relative stability suggests a chance for companies genuinely adding value through development success to see their share prices move higher. This was the experience in the late 1990s and early 2000s.
Still vulnerable cyclical conditions were aggravated in the second half of 2015 by a push from investors worldwide to reduce risk. Sector prices were pushed to a new cyclical low. These conditions were largely reversed through the first half of 2016 although sector prices have done little more than revert to mid-2015 levels.
With a median decline in prices of ASX-listed resources companies through the cycle of 89%(and 30% of companies suffering a decline of more then 95%), the majority of stocks remain prone to strong 'bottom of the cycle' leverage in response to even slight improvements in conditions.
Has Anything Changed?
A 1990s scenario remains the closest historical parallel although the strength of the US dollar exchange rate since mid 2014 has added an unusual weight to US dollar prices.
The first signs of cyclical stabilisation in sector equity prices have started to show. This has meant some very strong ‘bottom of the cycle’ gains.
Funding for project development may have passed its most difficult phase at the end of 2015 with signs of deals being done and evidence that capital is available for suitably structured transactions.
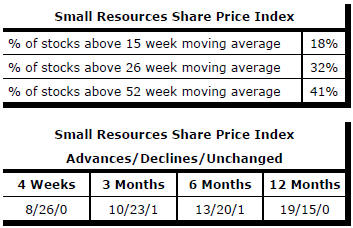
Key Outcomes in the Past Week
Market Breadth Statistics
Donald Trump continues to loom large over markets. More broadly, potentially destabilising political influences are gaining prominence.
French elections are imminent although the polls are favouring the eventual election of a centrist (albeit former socialist) candidate with a commitment to keeping France within the European Union.
Prime Minister Theresa May has unexpectedly called an early election to take advantage of a weak opposition and to enhance her Brexit negotiating position.
Donald Trump has flagged the release of details of what he wants in a tax reform package in the coming week. He also appears closer to cobbling together a majority in Congress to pass health insurance legislation after his previously aborted attempt.
Evidence of a more moderate tilt to the new president's policies and a reduction in the influence of the so-called economic nationalists with which he had surrounded himself during his election campaign should cheer markets. The latest example of a more moderate position is some emerging doubt about his determination to quit NAFTA, a longstanding campaign promise.
International relations also appear to be coming
under the guidance of professionals although the threat of a war with North
Korea has come into sharper focus with the potential to have a negative
impact on financial markets. To date, however, anxiety levels, even in
the face of a possible nuclear attack by the rogue state, seem low.
The direction of sector equity prices (represented by the ASX small resources share price index and shown in the blue line) has been dictated generally by the direction of commodity prices (represented in the chart as an index derived from the International Monetary Fund metals and energy price indices and shown in the yellow line).
There have been two significant departures in the pattern of joint movements.
During the first half of 2013, equity prices tumbled at a time of relative stability in commodity prices.
Since mid-2016, commodity prices have been on the rise while the share price index has changed little.
In 2013, the equity market had accurately anticipated a deterioration in economic conditions which would result in slumping commodity prices. The commodity price trough largely coincided with the trough in equity prices in late 2015.
The current a deviation might again be signaling lower commodity prices. There are some signs, such as falling Chinese growth momentum, of that being the case.
A disparity between equity prices, measured by the same index, and movements in yields on higher risk corporate bonds (shown in the sixth chart in the right hand panel) also highlights the recent underperformance of the index relative to other financial market conditions.
Both indicators point to equity price upside. Alternatively, the index may be suffering from the impact of short selling on the prices of some of its constituents stocks reflective of a tendency toward overpricing of better known companies by investors looking for sector exposure. This possibility is being highlighted in an upcoming ‘From the Capital’ column in Mining Journal: http://www.mining-journal.com/opinion/from-the-capital/
.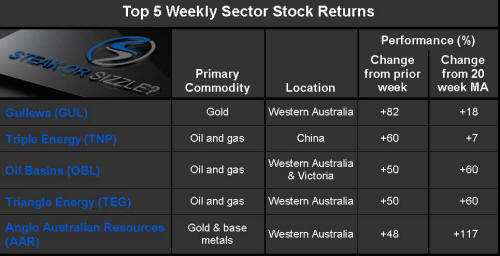
The Steak or Sizzle? blog LINK contains additional commentary on the best performed stocks in the sector and the extent to which their investment outcomes are underpinned by a strong enough value proposition to sustain the gains.