The Current View
Growth in demand for raw materials peaked in late 2010. Since then, supply growth has continued to outstrip demand leading to inventory rebuilding or spare production capacity. With the risk of shortages greatly reduced, prices have lost their risk premia and are tending toward marginal production costs to rebalance markets.
To move to the next phase of the cycle, an acceleration in global output growth will be required to boost raw material demand by enough to stabilise metal inventories or utilise excess capacity.
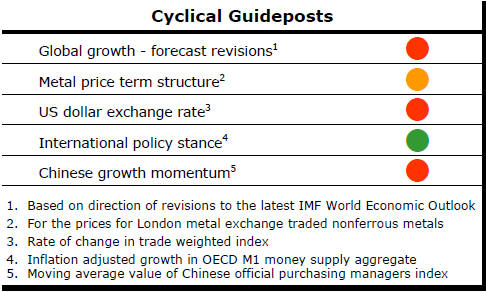
The PortfolioDirect cyclical
guideposts suggest that the best possible macroeconomic circumstances for
the resources sector will involve a sequence of upward revisions to
global growth forecasts, the term structure of metal prices once again
reflecting rising near term shortages, a weakening US dollar, strong money
supply growth rates and positive Chinese growth momentum. Only one of
the five guideposts is "set to green" suggesting the sector remains confined
to the bottom of the cycle .
Has Anything Changed? - Updated View
Since mid 2014, the metal market cyclical position has been characterised as ‘Trough Entry’ as prices have remained in downtrend with all but one of the PortfolioDirect cyclical guideposts - the international policy stance - flashing ‘red’ to indicate the absence of support.
The absence of a global growth acceleration, a stronger dollar and flagging Chinese growth momentum remain critical features of the current cyclical positioning.
Through February 2016, the first signs of cyclical improvement in nearly two years started to emerge. After 15 months of contango, the metal price term structure shifted to backwardation reflecting some moderate tightening in market conditions.
The metal price term structure is the most sensitive of the five cyclical guideposts to short term conditions and could, consequently, quickly reverse direction. Nonetheless, this is an improvement in market conditions and the guidepost indicator has been upgraded to ‘amber’ pending confirmation of further movement in this direction.
China's Growth Dilemma
China’s September quarter GDP estimate from the National Bureau of
Statistics permitted a wide range of interpretations about the trajectory of
the Chinese economy.
The chart shows quarterly GDP growth rates since the
beginning of 2011.

While more recent growth has been lower than at the beginning of this period, the last two quarters have not been noticeably out of line with outcomes over the prior four years despite widespread hand wringing about a Chinese economic slowdown.
The 1.8% growth rate in the September quarter reported by officials is equivalent to an annualised growth rate of 7.4% which is the way US statisticians would report their GDP growth estimate.
On this measure, China was running ahead of the target the Chinese government has all but given up any hope of reaching.
The most noticeable feature of the chart is the sharp slowdown in growth in the March quarter of 2016. As a result, growth over the 12 months ended September 2016 was only 5.0%.
The government actually reported “year-on-year growth” of 6.7%. This is a measure of the growth in average GDP in the four quarters ended September 2016 compared to average GDP in the four quarters ended September 2015.
There are enough data here to support an argument that there has been a growth slowdown. Alternatively, one could use the same statistics to argue growth has recovered sufficiently to be running ahead of targets.
Either of those conclusions depends, of course, on the credibility of the state-generated statistics which have often been described as made to suit the government of the day.
Dodgy statistics aside, the data suggest the government has been working hard to keep stimulus flowing through the financial system.
Unfortunately, sustaining growth at this rate is not necessarily compatible with attempts by the government to restructure the economy and change its principal growth drivers.
The desired heavier reliance on domestic demand will almost certainly result in lower growth than has been reported in the last two quarters.
Officials cautioned, in releasing the latest national accounts data, that “we must be aware that the economic development is still in a critical period of transformation and upgrading”. They also warned that “the foundation of continued economic growth is not solid enough”.
For the resources industry, the results are a mixed blessing.
The better than expected growth rates will have been helping to sustain raw material demand at a higher rate than would have otherwise been the case.
On the other hand, the slowdown, which many had thought had already occurred, is yet to happen. This suggests that further reductions in raw material demand are still to come as the government’s structural adjustment program continues.
Zinc Market Lacks Cyclical Strength
Zinc inventory levels falling to historically low levels have been the
crucial drivers of the three major zinc price cyclical adjustments to have
occurred over the past 50 years.
Between these major cyclical moves, prices have tended to experience more moderate movements although during these periods, too, the correlation with stock movements has remained important.
Expectations that zinc prices will go higher have been
stoked by mine closures due to ore exhaustion in Europe and Australia.

According to the International Lead Zinc Study Group, mine production fell by 0.4% in 2015 and, in the first seven months of 2016, was 6.0% lower than in the corresponding period of 2015.
Metal production has been cut back by 3.9% in 2016 but growth in metal usage has remained very subdued.
After having remained unchanged in 2015, usage has increased by just 0.7% over the first seven months of 2016.
Although the zinc metal market has been in deficit so far in 2016, the ILZSG has estimated that the total fall in inventories has been limited to 17,000 tonnes.
The market deficit will keep some modest upward pressure on prices but probably not enough to support a genuine cyclical response.
As in the cases of other market segments, a meaningful cyclical move in prices will require an acceleration in global growth rates to hasten the necessary rundown in inventories.


