The Current View
Growth in demand for raw materials peaked in late 2010. Since then, supply growth has continued to outstrip demand leading to inventory rebuilding or spare production capacity. With the risk of shortages greatly reduced, prices have lost their risk premia and are tending toward marginal production costs to rebalance markets.
To move to the next phase of the cycle, an acceleration in global output growth will be required to boost raw material demand by enough to stabilise metal inventories or utilise excess capacity.
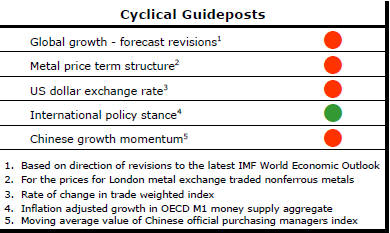
The PortfolioDirect cyclical
guideposts suggest that the best possible macroeconomic circumstances for
the resources sector will involve a sequence of upward revisions to
global growth forecasts, the term structure of metal prices once again
reflecting rising near term shortages, a weakening US dollar, strong money
supply growth rates and positive Chinese growth momentum. Only one of
the five guideposts is "set to green" suggesting the sector remains confined
to the bottom of the cycle .
Has Anything Changed?
Throughout 2014, PortfolioDirect had been characterising the cyclical position as ’Trough Entry’ with some expectation that by the end of 2014 an exit would be evident. Until very late in the year, the evidence supported that possibility before conditions took several backward steps.
The absence of a growth acceleration among the major economic regions is contributing to the flagging momentum. A stronger US dollar is also imparting a downward bias to US dollar denominated prices presently.
This change has been enough to define a fresh cycle and a more prolonged adjustment process.
Hope Persists but Evidence Supporting Stable
Asset Prices is Limited
Another year begins with the hope that mining asset prices have stabilised
but the supporting evidence is mixed, at best.
One fund manager at London’s December Mines and Money investment conference said he had never seen such a wide disparity between the prices being asked by owners of mining assets and the prices investors were prepared to pay. His remarks will not have been entirely dispassionate but they warned of further downside in asset values. Write-downs and more dilution in the equity positions of existing investors looms as 2016 begins.
Many in the industry will have been hoping for the sequence of negative price adjustments to have run their course. The 15.6% decline in Australia’s small resources share price index in 2015 was its smallest decline since the market rout commenced in 2008 and, in a market characterised by wild cyclical swings, the smallest absolute percentage movement in the index in over a decade.
Optimistically, one might be tempted to infer a transition to more stable prices. Here are five reasons why that might be so.
Falling asset prices have been a product of previously overenthusiastic investment. Today’s reticence to invest, if history is any guide, will be the source of future asset price buoyancy. This is nature at work. Weakness eventually gives way to strength as surely as floods succeed drought.
The ongoing need for new investment is a second reason to expect greater stability in asset prices. Despite occasional expressions of extreme pessimism about global demand, changes in the amount of metal being used have not been severe by normal cyclical standards. Record production levels have been needed to meet demand in many market segments and record or near record output will still be needed in the year ahead.
The Australian small resources share price index - the most reliable guidepost to sector investment returns in the Australian market - is now little different to where it was in September 2015 and around levels which had prevailed in 1998-2001. Mathematically, prices can fall 15% a year forever but the severity of the decline already evident and the comparison with historical prices adds weight to the argument for an approaching nadir.
Fourthly, returns from competing investments are falling. Financial services companies led the recovery from the 2008-09 global recession. Technology providers and disruptors of traditional businesses have also been grabbing investment market headlines. A potent combination of need and rapid scientific progress has supported pharmaceutical and health care investments. But all these parts of the market, and more, have begun to flounder. Geographically, the China market has also lost its buoyancy. U.S. monetary policy is offering less support for equity prices. And, most conspicuously, a long term bull market in bond prices is showing signs of having climaxed. An enormous competitive disadvantage which had been a drag on investor interest in the resources sector has given way to a more level playing field.
A fifth potential source of asset price stability comes from frequently ignored but unusually large movements in exchange rates leading to geographic differences in asset attractiveness. Uranium, although an extreme example, is illustrative. During 2015, U.S. dollar prices were little changed but the world’s largest producer took an additional 50% local currency gain from a Kazakhstan tenge decline. A 10% rise in Australian dollar gold prices shored up Australian asset values.
The market is closing in on more sustainable asset price points but it is just as easy to come up with five reasons the multi-year price adjustment still has room to run.
Miners continue to inflate valuations with overly optimistic views about business conditions. In this, they are only fooling themselves. One example is the tendency for metal miners to extrapolate 2010-2014 usage growth rates while macroeconomists are continuing to pare back global growth forecasts. Many investment pitches from 2015 need editing to take account of growth impacts that have already occurred let alone any still to come.
The use of financing costs far lower than those available to real world investors in marketing pitches is another source of the wide bid-offer spread. With high-risk financing costs having turned and now on the rise, virtually all miners with projects on the table should be cutting back their valuations as they enter 2016.
Thirdly, the anti-mining bias among investor gate-keepers is intensifying. This constraint on industry financing in Australia was a theme in my December Mines and Money presentation. One Australian company chairman expressed surprise recently at his broker asking all the participants in a capital raising to sign a document affirming they had invested without the advice of the broker. This is the new normal. Driven by their compliance managers, fewer and fewer intermediaries are prepared to put their weight behind stock recommendations.
Independently, Canadian sector analyst and commentator John Kaiser offered much the same assessment for Canada when speaking in London. Stricter compliance regimes are preventing the flow of funds from historical sources of support for the sector.
The fourth reason to expect a continuation of negative re-pricing in 2016 is poor exploration hit rates. Companies looking to discard unappealing assets to meet administrative costs or plug holes in higher priority exploration budgets hint at more downside pressures.
Fifthly, a dimming memory of historical prices makes escape from a cyclical price trough tougher. What had once been a $2 per share company is commonly found trading at 15 cents. But a jump in price to 50 or even 30 cents now appears like an extraordinary profit. Such a strong temptation to sell puts a lid on the chances of meaningful price recovery.
Whether the bid-offer spread for sector assets is historically large remains unclear but the forces contributing to price discovery remain balanced at best and possibly tilted toward the negative as 2016 begins. .