The Current View
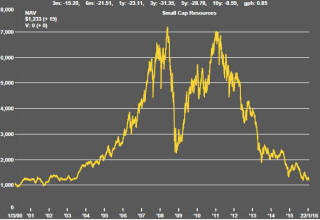
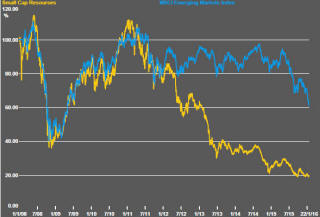
A lengthy downtrend in sector prices had given way to a relatively stable trajectory after mid 2013 similar to that experienced in the latter part of the 1990s and first few years of the 2000s.
The late 1990s and early 2000s was a period of macroeconomic upheaval during which time sector pricing nonetheless proved relatively stable. That remains a possible scenario for sector prices.
Relative stability suggests a chance for companies genuinely adding value through development success to see their share prices move higher. This was the experience in the late 1990s and early 2000s.
The lower equity prices fall - and the higher the cost of capital faced by development companies - the harder it becomes to justify project investments. The market is now entering a period prone to even greater disappointment about project delivery .
Has Anything Changed?
The assumption that June 2013 had been the cyclical trough for the market was premature.
Sector prices have adjusted to the next level of support. The parallel with the 1990s illustrated in Chart 4 is being tested. Prices will have to stabilise around current levels for several months for the thesis to hold.
Key Outcomes in the Past Week
Last week finished with some predictions that the weakest phase in an oversold U.S. equity market had occurred on Wednesday when the S&P 500 fell 3.7% at its worst and oil prices (WTI) dropped below $28/bbl. By the end of Friday, however, sentiment had shifted. The S&P 500 had regained 5.2% and oil prices had topped $32/bbl. Equity prices ended up rising 1.4% over the week.
Talk of a U.S. recession has picked up with several investment banks raising the probability they attach to a GDP contraction in the coming year. This is a largely symbolic gesture in that it allows analysts to cover the risk of some deterioration in growth without damaging their reputations in the event the economy continues to expand. The 20% risk of recession, forecast by some, means an 80% chance of ongoing expansion.
The International Monetary Fund has again downgraded its growth forecast for 2016.This had little effect as markets seemed already to have factored in something worse. Nonetheless, the Fund’s revisions warrant further cuts in raw material demand forecasts which are not yet evident in market analyses extrapolating unusually strong average growth from 2009-2014.
The preoccupation with Chinese economic outcomes remained a feature of market movements. Many commentaries about Chinese growth continue to imply that there had been a meaningful prospect of growth being sustained above 7% and closer to historical averages than recent outcomes. This was never a chance for a restructuring and a maturing Chinese economy already having taken advantage of the most significant market liberalisation benefits. Growth is more likely to stabilise closer to 5%. In the absence of a transition in thought to accommodate such an outlook, market nervousness about China will persist. There is no offsetting upside scenario.
The one bright point on the China front is of the rising expectation that more monetary stimulus will be forthcoming to indirectly support global equity markets. European central bank president Mario Draghi also re-entered the assessment of market conditions when he suggested that more stimulus would also be available from Europe if needed. The Europeans have been prone to promise more from time to time while being cautious about taking action.
The importance of exchange rate movements continues to be underrated as a driver of market conditions. The stronger U.S. dollar is taking a toll on U.S. manufacturing competitiveness which, coinciding with a savaging of oil sector investment, is weakening U.S. growth and corporate earnings potential.
There should be winners as well as losers from these exchange rate changes but the potential national economic beneficiaries are constrained, in many cases, by structural impediments holding back a more positive growth response, notably among emerging market economies.
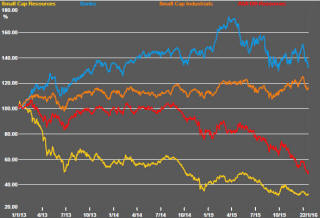
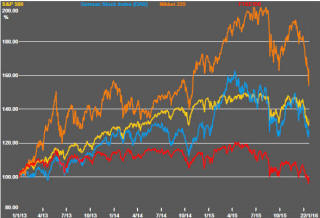
There should be a connection between Australia’s
resource sector equity prices and international high yield bond prices and,
in practice, over the last two years sector equity prices have displayed a
leveraged response to movements in bond yields.
High yield bond prices are a general indicator of movements in the price of capital for riskier investments such as those in the mining industry. With the U.S. oil and gas sector facing unprecedented financial pressures, high yield prices are currently also reflecting their greater chance of default and an assessment of global growth prospects by financial markets.
High yield prices (represented in the chart by the iShares U.S. dollar high yield bond ETF) hit their lowest point on Wednesday amid a broader sell-off of financial assets. The end of week recovery would normally benefit resource sector equity prices insofar as it raises the prospect of stabilising demand for risky assets but the recent price action could just as easily be construed as signaling further weakness.
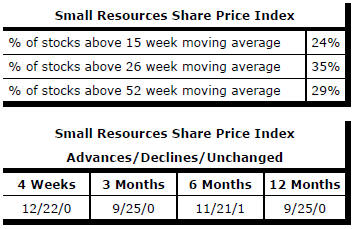
Market Breadth Statistics