The Current View
Growth in demand for raw materials peaked in late 2010. Since then, supply growth has continued to outstrip demand leading to inventory rebuilding or spare production capacity. With the risk of shortages greatly reduced, prices have lost their risk premia and are tending toward marginal production costs to rebalance markets.
To move to the next phase of the cycle, an acceleration in global output growth will be required to boost raw material demand by enough to stabilise metal inventories or utilise excess capacity.
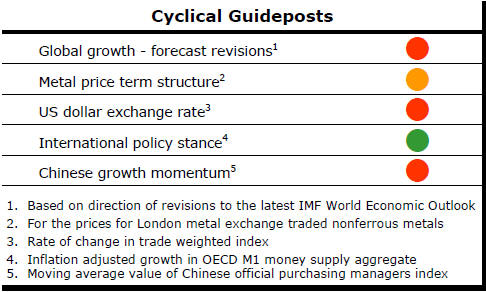
The PortfolioDirect cyclical
guideposts suggest that the best possible macroeconomic circumstances for
the resources sector will involve a sequence of upward revisions to
global growth forecasts, the term structure of metal prices once again
reflecting rising near term shortages, a weakening US dollar, strong money
supply growth rates and positive Chinese growth momentum. Only one of
the five guideposts is "set to green" suggesting the sector remains confined
to the bottom of the cycle .
Has Anything Changed? - Updated View
Since mid 2014, the metal market cyclical position has been characterised as ‘Trough Entry’ as prices have remained in downtrend with all but one of the PortfolioDirect cyclical guideposts - the international policy stance - flashing ‘red’ to indicate the absence of support.
The absence of a global growth acceleration, a stronger dollar and flagging Chinese growth momentum remain critical features of the current cyclical positioning.
Through February 2016, the first signs of cyclical improvement in nearly two years started to emerge. After 15 months of contango, the metal price term structure shifted to backwardation reflecting some moderate tightening in market conditions.
The metal price term structure is the most sensitive of the five cyclical guideposts to short term conditions and could, consequently, quickly reverse direction. Nonetheless, this is an improvement in market conditions and the guidepost indicator has been upgraded to ‘amber’ pending confirmation of further movement in this direction.
Near Term Cyclical Improvement from Exchange
Rates
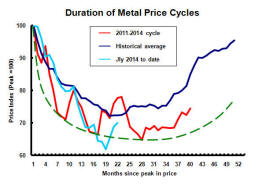
The updated PortfolioDirect metal price cycle model (illustrated on the
right) shows a clear improvement in price outcomes in the past week.
Despite the rise in metal prices, they remain below average for this point in the cycle.
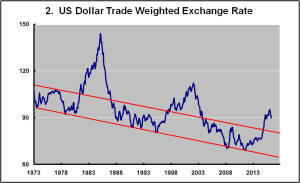
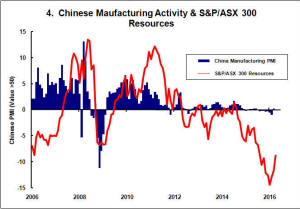
Critical to the changed momentum of metal prices has been the directional change in the U.S. dollar (Chart 2). Both the upward move in the currency and, now, its change in direction have coincided with opposing movements in metal prices.
Without an acceleration in global growth, progression of the metal price cycle will depend heavily on the US dollar exchange rate continuing to fall.
Such an outcome cannot easily be assumed. The U.S. dollar exchange rate will be a product of a complex set of monetary relationships influenced by competing central bank policy settings in Europe, Japan, China and the USA.
At the moment, prospective monetary policy settings appear more likely to result in a higher U.S. dollar with the sequence of U.S. tightening running ahead of monetary policy settings elsewhere. This will reapply downward pressure on metal prices. But the strength of this outcome does depend on policy failing elsewhere.
Signs of rising inflation outside the USA - possibly in response to fresh upcoming policy initiatives – will most likely result in non-U.S. dollar exchange rates drifting higher, if not spiking sharply.
This is the most optimistic scenario available to a mining industry depending on improved metal prices for a re-rating of equity values but confronting a world economy without significant momentum in global growth to help rebalance markets.
IMF Forecasts Slip Again
“Less room for error” is the sombre message in the latest review of the
world economy from the International Monetary Fund. As growth slides lower,
the greater the risk of the world economy slipping into recession with
policymakers unable to respond fast enough to the downward momentum to
prevent it from happening.
Global growth forecasts for 2016 and 2017 show a very slight acceleration but, over repeated forecast rounds, the Fund’s outlook has become progressively less optimistic.
Over the past two years, actual growth has fallen well short of the IMF forecast a year ahead. The Fund's subsequent forecasts, during the years in question, have been closer to the mark.
The track record over the past two years would suggest that the latest forecast has taken account of the downside risks for 2016. The track record might also suggest that the fresh 2017 forecasts, already starting from the lowest base since 2010, has room to move on the downside.
For those investors looking for signs of a cyclical recovery in resource sector equity prices, the IMF analysis offers a particularly pessimistic implication.
Cycles typically arise when raw material producers are caught off-guard by unexpectedly strong global economic growth. Fears of companies being unable to meet the consequent increase in raw material demand are at the heart of the upward phase of a price cycle. That prospect appears increasingly dim.
Of course, the IMF may be succumbing to the forecasters’ nightmare, namely, becoming most pessimistic at a turning point. There are, however, good reasons for its attitude.
In no major economic region is growth showing signs of strengthening materially. Central banks are focussed on asset prices rather then the real economy as they struggle (with very limited support from governments) to keep inflation up.