The Current View
Growth in demand for raw materials peaked in late 2010. Since then, supply growth has continued to outstrip demand leading to inventory rebuilding or spare production capacity. With the risk of shortages greatly reduced, prices have lost their risk premia and are tending toward marginal production costs to rebalance markets.
To move to the next phase of the cycle, an acceleration in global output growth will be required to boost raw material demand by enough to stabilise metal inventories or utilise excess capacity.
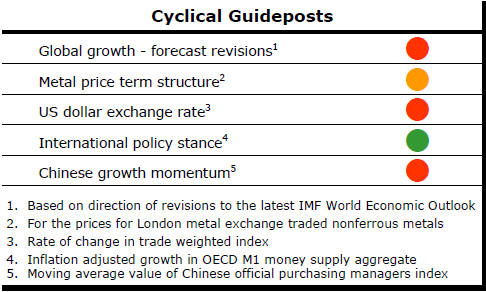
The PortfolioDirect cyclical
guideposts suggest that the best possible macroeconomic circumstances for
the resources sector will involve a sequence of upward revisions to
global growth forecasts, the term structure of metal prices once again
reflecting rising near term shortages, a weakening US dollar, strong money
supply growth rates and positive Chinese growth momentum. Only one of
the five guideposts is "set to green" suggesting the sector remains confined
to the bottom of the cycle .
Has Anything Changed? - Updated View
Since mid 2014, the metal market cyclical position has been characterised as ‘Trough Entry’ as prices have remained in downtrend with all but one of the PortfolioDirect cyclical guideposts - the international policy stance - flashing ‘red’ to indicate the absence of support.
The absence of a global growth acceleration, a stronger dollar and flagging Chinese growth momentum remain critical features of the current cyclical positioning.
Through February 2016, the first signs of cyclical improvement in nearly two years started to emerge. After 15 months of contango, the metal price term structure shifted to backwardation reflecting some moderate tightening in market conditions.
The metal price term structure is the most sensitive of the five cyclical guideposts to short term conditions and could, consequently, quickly reverse direction. Nonetheless, this is an improvement in market conditions and the guidepost indicator has been upgraded to ‘amber’ pending confirmation of further movement in this direction.
Iranian Demographics Drive Growth Lower
Iran is a dramatic example of the interaction of religion, changing social
mores, health and lifestyle on economic growth outcomes.
The chart, based on data from ‘UN World Population Prospects’ shows the trend in the number of children born per Iranian woman in each five year period since 1950. The decline from 6.91 to 1.62 is only greater in Singapore and St Vincent and the Grenadines.
In 1950, of the 6,910 children to which 1000 Iranian
women would have given birth, on average, 2,059 would have died before
reaching the age of five. A consistently falling death rate means that only
24 of the 1,620 children now born per 1000 Iranian women will die before
reaching five years of age.
The welcome improvement in infant health will have removed some of the pressure for a high birth rate but the full strategic impact of the reaction among Iran’s female population has yet to be felt.
The 1,596 survivors past the age of five are not enough to keep Iran’s current population of 80 million people growing over the longer term.
The negative impact of a population decline on economic success and regional prestige threatens geopolitical instability as leaders are tempted to look to non-economic means to shore up lost regional influence.
The shifts in fertility highlight the limitations on governments being able to dictate outcomes unacceptable to the broader population. Conversely, the dramatic change in fertility rates also show how speedily economic growth rates can be modified in the event that acceptable policies and incentives are implemented.
Gold Overpriced
Gold is overpriced relative to a selection of financial market indicators
commonly used to benchmark gold price movements.
The average gold price implied by the selected indicato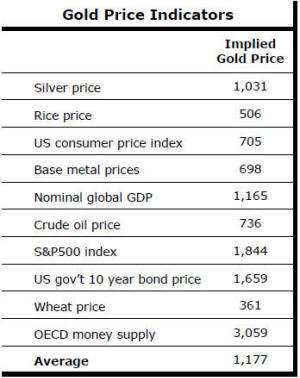 rs
is US$1,177/oz compared to a current price of $1,318.
rs
is US$1,177/oz compared to a current price of $1,318.
Gold prices are formed from a combination of macroeconomic forces, primarily changes in relative prices, and periodic movements in wealth distribution such as occurred with the oil price shocks in the 1970s and the rise of China as a modern economic power in the 2000s.
Being the consequence of the interaction of so many different variables globally, forecasting gold prices has been notoriously difficult especially due to the instability in the relationships with other prices.
The table shows ten globally significant prices and financial variables with a potential bearing on gold prices.
The gold price currently implied by each of the variables is based on long term historical relationships between the average gold price and each of the variables between 1975 and 2000.
Pause in Falling US Oil Rig Count
The momentum of the U.S. oil industry adjustment which had been supporting
higher crude prices has shown signs of faltering.
Over the past two weeks, the number of drilling rigs operating in the USA has risen for the first time after falling through 2015.
 It
might be premature to proclaim the two week shift as a directional change
rather than a pause in an ongoing decline but an increase would be
consistent with a response to the stronger crude prices over the past
several months.
It
might be premature to proclaim the two week shift as a directional change
rather than a pause in an ongoing decline but an increase would be
consistent with a response to the stronger crude prices over the past
several months.
Meanwhile, production has continued lower. The production trend could persist even as the number of rigs increases as aging wells become less productive.
Rising or even stabilising production as the rig count continues to climb might signal a return to downward price pressures. Presumably, there will also be an equity market effect from a reversion to lower prices by throwing up fears of loan defaults among U.S. financial institutions.