The Current View
A lengthy downtrend in sector prices had given way to a relatively stable trajectory after mid 2013 similar to that experienced in the latter part of the 1990s and first few years of the 2000s.
The late 1990s and early 2000s was a period of macroeconomic upheaval during which time sector pricing nonetheless proved relatively stable. That remains a possible scenario for sector prices.
Relative stability suggests a chance for companies genuinely adding value through development success to see their share prices move higher. This was the experience in the late 1990s and early 2000s.
The lower equity prices fall - and the higher the cost of capital faced by development companies - the harder it becomes to justify project investments.
Has Anything Changed?
A 1990s scenario remains the closest historical parallel although the strength of the US dollar exchange rate since mid 2014 has added an unusual weight to US dollar prices.
The first signs of cyclical stabilisation in sector equity prices have started to show. This has meant some very strong ‘bottom of the cycle’ gains but only after prices have already fallen by 70% or more in many cases leaving prices still historically low.
Funding for project development may have passed its most difficult phase at the end of 2015 with signs of deals being done and evidence that capital is available for suitably structured transactions.
Key Outcomes in the Past Week
Equity prices and oil prices went in opposite directions during the week as signs of a weakening oil market re-emerged. Meanwhile, despite some mixed results, the overall tone of the earnings reports for the June quarter among S&P 500 companies have helped equity prices.
Despite improved equity market sentiment, resource sector prices tended lower during the week after recent gains. A stronger US dollar contributed to a loss of commodity price momentum which affected resource sector outcomes adversely.
The S&P 500 implied volatility index fell to within a few points of historically low levels signalling an unusual level of comfort about current market conditions.
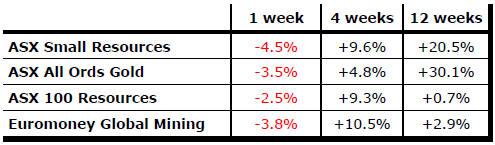
 High
yield corporate bond prices moved higher signalling an improved appetite for
risk although some tension may arise between these prices and the lower
price of crude oil if renewed fears of industry defaults emerge again.
High
yield corporate bond prices moved higher signalling an improved appetite for
risk although some tension may arise between these prices and the lower
price of crude oil if renewed fears of industry defaults emerge again.
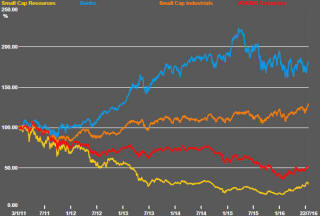
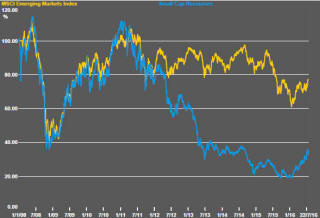
The rising volatility in the ASX small resources share price indicator (see chart 3 opposite) suggests that the market risks in the near term have turned negative after prices had recouped their 2015 losses.
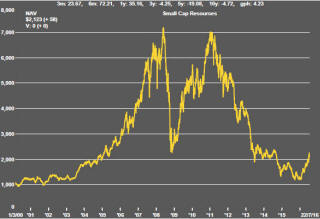
Within the resources sector, some tendency for
prices to revert to where they had been trading during 2013-14 is evident
after a period of more intense weakness in the latter part of 2015. This
can be seen in the small resources share price indicator (chart 1 opposite)
 as
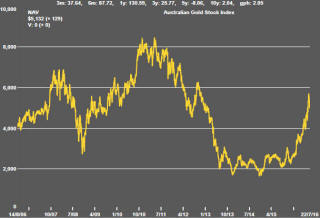
well as individual stocks. Gold is the only sector (see chart 6 opposite)
with enough momentum to break beyond these levels.
as
well as individual stocks. Gold is the only sector (see chart 6 opposite)
with enough momentum to break beyond these levels.
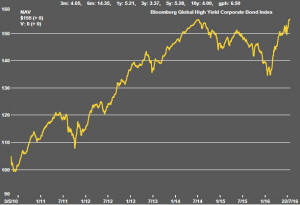
The lithium sector is more typical. It had been displaying unusually strong price action but only enough to take it back to its 2013-14 levels.
The question now is whether there is enough positive sentiment, particularly toward smaller stocks, to sustain the price momentum displayed in recent months or whether that has been as strong as markets are likely to get for the time being.
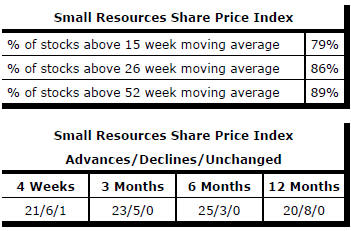
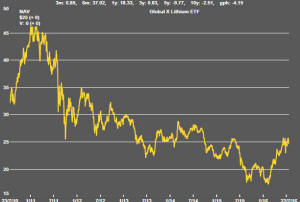
Market Breadth Statistics