The Current View
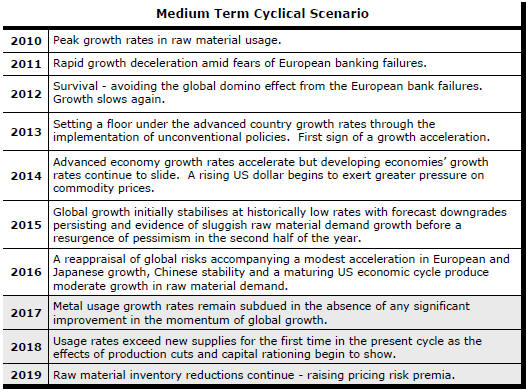
Growth in demand for raw materials peaked in late 2010. Since then, supply growth has generally outstripped demand leading to inventory rebuilding or spare production capacity. With the risk of shortages greatly reduced, prices lost their risk premia and have been tending toward marginal production costs to rebalance markets.
The missing ingredient for a move to the next phase of the cycle is an acceleration in global output growth which boosts raw material demand by enough to stabilise metal inventories or utilise excess capacity.
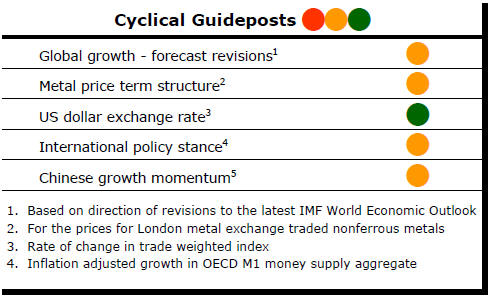
The PortfolioDirect cyclical
guideposts suggest that the best possible macroeconomic circumstances for
the resources sector will involve a sequence of upward revisions to
global growth forecasts, the term structure of metal prices once again
reflecting rising near term shortages, a weakening US dollar, strong money
supply growth rates and positive Chinese growth momentum. Only one of the five guideposts is "set to green"
(after the most recent adjustments in July 2017) suggesting the sector remains confined
to near the bottom of the cycle.
Has Anything Changed? - Updated View
From mid 2014, the metal market cyclical position was characterised as ‘Trough Entry’ with all but one of the PortfolioDirect cyclical guideposts - the international policy stance - flashing ‘red’ to indicate the absence of support.
Through February 2016, the first signs of cyclical improvement in nearly two years started to emerge. The metal price term structure reflected some moderate tightening in market conditions and the guidepost indicator was upgraded to ‘amber’ pending confirmation of further movement in this direction.
As of early December 2016, the Chinese growth momentum indicator was also upgraded to amber reflecting some slight improvement in the reading from the manufacturing sector purchasing managers index. Offsetting this benefit, to some extent, the policy stance indicator was been downgraded from green to amber.
The most recent change in cyclical guidepost positioning has been at the end of July 2017 when the exchange rate guidepost was upgraded to green.
Few Winners In Cost Competition
Efforts to cut
production costs always loom large in the aftermath of a cyclical decline in
industry conditions but sustaining competitiveness benefits is rare.
A company’s positioning on an industry cost curve gives investors a handy guide to how geology, metallurgy, logistics, infrastructure and marketing have combined.
Being low on the cost curve tells investors a project has a higher than average chance of surviving a cyclical downturn.
Analytically, the positioning on a cost curve may be less important than the shape of the curve itself. New entrants sheltered by a sharply rising curve have greater flexibility in defining their cost outcomes or sustaining targeted profit margins.
The irrelevance of costs in stronger cyclical conditions is readily evident in the current lithium market.
Strategically, the priority task for an aspiring lithium producer is to stake out a market position as quickly as possible.
Orocobre, one of the first of the new entrants into the industry, had targeted a $2,000/tonne production cost. According to its most recent disclosures, Orocobre is running some 75% above this target without any seriously adverse consequences for future production.
If anything, the pressures to compete facing the current generation of industry executives are less severe than those encountered by their predecessors.
In the late 1970s and into the recession prone 1980s, for example, miners in advanced economies were challenged by the impact of so-called social metal. State-owned metal producers in South America and Africa were accused of targeting unsustainably high production based on marginal cash costs to meet government fiscal objectives.
Price pressures, including those from historically high US dollar exchange rates, and the costs of meeting more stringent environmental rules forced US copper producers to close large swathes of the industry in the 1980s and slash corporate overheads to restore profits. Under sustained pressure to do more, some turned to solvent extraction/electrowinning to engineer a more radical cost transformation.
A producer acting alone might have stolen a competitive advantage but many pursuing the same policies simultaneously resulted in a flatter cost curve with little discernible improvement in industry-wide profitability as prices chased costs lower.
The energy intensive aluminium industry, faced with losing competitiveness from higher power costs, had to cut production and permanently mothball plants in the USA in the aftermath of recession to average down its unit costs with a similar effect on its cost curve.
Even with the best of intentions, published cost curves are spuriously precise.
For a start, a cost curve is not even a snapshot at a single point. The necessarily historical information analysts accumulate for constructing a single cost curve typically covers a span of time. Data may be outdated well before it is collated and repackaged.
Subsequent changes to exchange rates, tax regimes, relative inflation and wages could render any curve obsolete as a measure of the present let alone what might happen in the future.
Beyond the most compellingly low cost projects, cost curve positioning is inherently unstable making it a sometimes convenient investment lure prior to development but of doubtful longer term analytical value.
Once development has occurred, companies have little scope to materially improve their cost curve positioning. Miners must take as given the location of an orebody, its geological setting and the efficiency of the associated infrastructure.
In contrast, a manufacturer can relocate a plant, introduce radically new production technologies, change input materials or alter brand positioning to improve competitiveness.
Manufacturers generally confront sticky prices and work on costs to improve margins and returns on capital.
Sticky costs, on the other hand, force miners to rely on prices for better margins or returns on their invested funds.
C1 cost estimates omit a range of charges with an impact on business sustainability including taxes, debt servicing and corporate expenses – much like ignoring goals scored in the last 20 minutes of a football match in defining winners and losers.
For the vast majority of companies in the sector, locational decisions are guided by circumstances rather than cost analysis.
Those at the small end of the industry might prefer to own Escondida but know they will have to settle for a limited life small-scale mine in Tasmania (or somewhere similar) because that is as far as their exploration efforts and budgets can carry them.
For even the biggest companies with global perspectives, luck plays an important role.
BHP needed General Electric to quit mining before it could acquire the Escondida copper mine. It could buy Olympic Dam only because WMC directors gave up the fight. Glencore mines at Mount Isa for similar reasons.
Project development requires optimisation of resource size, unit costs and capital availability characteristics.
So, Sundance Resources might have had one of the most impressive iron ore deposits outside Brazil and the Pilbara but potentially huge capital needs overwhelmed its own balance sheet, delayed progress and eventually obliterated operating cost advantages.
In the fertiliser commodity space, Parkway Minerals is a contemporary example of globally significant size and cost advantages, at least on paper, but apparently insuperable capital sourcing barriers stymieing development.
Capital availability driven by macro pressures is frequently trumping costs as a factor determining development prospects.
Phased capital deployment to facilitate quick development using early stage cash flows to fund larger developments down the track has been one response. The trend to more aggressive capital management has meant even less emphasis on costs as a primary development filter.
At the pre-production stage, cost curve positioning will be one ingredient in defining the likelihood of commercial success but insufficient on its own to confirm an investible proposition.
For a company already in production, cost saving initiatives can buy time after a cyclical downturn but an array of more powerful external factors can easily make eventual cost curve positioning more of a tactical lottery than the outcome of careful strategic planning.