The Current View
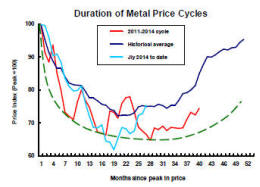
Growth in demand for raw materials peaked in late 2010. Since then, supply growth has continued to outstrip demand leading to inventory rebuilding or spare production capacity. With the risk of shortages greatly reduced, prices have lost their risk premia and are tending toward marginal production costs to rebalance markets.
To move to the next phase of the cycle, an acceleration in global output growth will be required to boost raw material demand by enough to stabilise metal inventories or utilise excess capacity.
The PortfolioDirect cyclical
guideposts suggest that the best possible macroeconomic circumstances for
the resources sector will involve a sequence of upward revisions to
global growth forecasts, the term structure of metal prices once again
reflecting rising near term shortages, a weakening US dollar, strong money
supply growth rates and positive Chinese growth momentum. Only one of
the five guideposts is "set to green" suggesting the sector remains confined
to the bottom of the cycle .

Has Anything Changed? - Updated View
Since mid 2014, the metal market cyclical position has been characterised as ‘Trough Entry’ as prices have remained in downtrend with all but one of the PortfolioDirect cyclical guideposts - the international policy stance - flashing ‘red’ to indicate the absence of support.
The absence of a global growth acceleration, a stronger dollar and flagging Chinese growth momentum remain critical features of the current cyclical positioning.
Through February 2016, the first signs of cyclical improvement in nearly two years started to emerge. After 15 months of contango, the metal price term structure shifted to backwardation reflecting some moderate tightening in market conditions.
The metal price term structure is the most sensitive of the five cyclical guideposts to short term conditions and could, consequently, quickly reverse direction. Nonetheless, this is an improvement in market conditions and the guidepost indicator has been upgraded to ‘amber’ pending confirmation of further movement in this direction.
Improved Metal Prices
A noticeable improvement in the cyclical positioning of metal prices over
the past several weeks has been helped by the US dollar edging toward the
low end of its trading range and as the threat of going lower has begun to
loom larger in response to modified interest rate expectations.
Exchange rate movements can be an important factor in setting the level of metal prices but the growth picture, on which a genuine cyclical outcome depends, remains unsupportive.
Global Trade Growth Downgrades
If anything, the growth outlook has worsened with a succession of
international economic organisations warning of a decline in the growth of
global trade.
The chart shows a 30 year history of global output growth rates (in the blue line) and changes in the volumes of world trade, as calculated by the International Monetary Fund.
While, unsurprisingly, changes in trade volumes have been more volatile than output changes, traded growth has typically outpaced output growth. This is about to change, according to the most recent forecasts.
Trade growth has been an external factor on which countries have been able to depend to supplement underlying domestic growth rates.
Trade growth has encouraged productivity improvements and the welfare benefits which have come from more efficient allocation of resources globally. Higher trade volumes both encourage and benefit from supply chain efficiencies.
With China attempting to source its growth from more domestically oriented activities, trade growth would have been curtailed, in any event. But with slowing growth more generally, trade volumes have been under pressure. A relatively strong US dollar and recent rises in the yen exchange rate have also constrained trade growth and, with that, the strength of the economic activity in two of the world’s largest economies.
For the mining industry, the ebbing growth in the trade in goods is also a warning sign that the metal intensity of global output is moderating.
Ongoing reductions in global growth forecasts offer little hope of a near term resurgence in trade growth.
Despite output growth forecasts having been pulled back to unusually low levels already, trade growth forecasts are being pared back in much the same fashion as they would be in the event of a global recession.
The World Trade Organization is now forecasting global trade to grow by less than global output in 2016 and 2017. The WTO has cut its 2016 forecast to just 1.7%. Its 2017 trade growth forecast is now 1.8-3.1%.
Falling Japanese Output
Anaemic trade outcomes have dented Japan’s growth potential. The Japanese
government has estimated that industrial production declined 0.4% in July
leaving output 0.9% lower than in July 2015.
While production rates have ebbed and flowed in
 response
to policy and exchange rate movements, little net progress has been made.
Output is lower now than it was at the beginning of 2010.
response
to policy and exchange rate movements, little net progress has been made.
Output is lower now than it was at the beginning of 2010.
Output growth in the early 2000s which had been more consistently positive than at any time since Japan’s recession of the early 1990s has given way to very volatile conditions which have offered industries little chance of consolidating or expanding market positions.