The Current View
Growth in demand for raw materials peaked in late 2010. Since then, supply growth has continued to outstrip demand leading to inventory rebuilding or spare production capacity. With the risk of shortages greatly reduced, prices have lost their risk premia and are tending toward marginal production costs to rebalance markets.
To move to the next phase of the cycle, an acceleration in global output growth will be required to boost raw material demand by enough to stabilise metal inventories or utilise excess capacity.
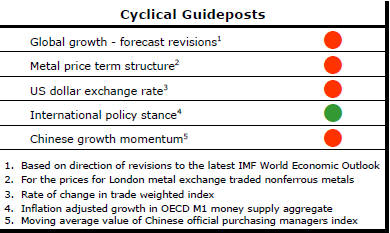
The PortfolioDirect cyclical
guideposts suggest that the best possible macroeconomic circumstances for
the resources sector will involve a sequence of upward revisions to
global growth forecasts, the term structure of metal prices once again
reflecting rising near term shortages, a weakening US dollar, strong money
supply growth rates and positive Chinese growth momentum. Only one of
the five guideposts is "set to green" suggesting the sector remains confined
to the bottom of the cycle .
Has Anything Changed?
Throughout 2014, PortfolioDirect had been characterising the cyclical position as ’Trough Entry’ with some expectation that by the end of 2014 an exit would be evident. Until very late in the year, the evidence supported that possibility before conditions took several backward steps.
The absence of a growth acceleration among the major economic regions is contributing to the flagging momentum. A stronger US dollar is also imparting a downward bias to US dollar denominated prices presently. This is looking less like a temporary move than a multiyear change of direction.
The flow of metal market statistics is pointing to a marked slowing in usage growth in 2015.
Cyclical Conditions Worsen
The metal price cyclical positioning indicator is pointing to a further
deterioration. The gap between where prices are today and where they have
been thus far from their peak, on average, has continued to widen.
The chart even suggests some possibility there might have been a more recent cycle within a cycle in which prices have retreated from levels that had not been regarded as especially high.
A stronger U.S. dollar is one aspect of the metal price decline. Another is the mounting evidence that global growth is unlikely to differ materially in the year ahead from the outcome in the year just passed. The absence of an acceleration in global growth affects disproportionately the growth in raw material usage rates and has a negative impact on the speed of market balance adjustment.
Without a change in momentum from growth or the exchange
rate, pressure to maintain the current direction of prices will remain. 
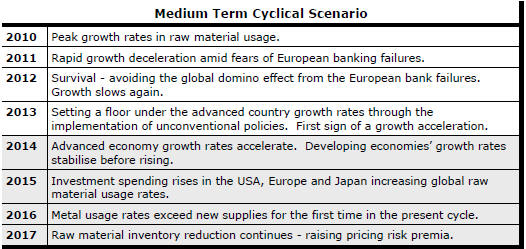
The strongest growth in raw material usage usually occurs in the earliest stages of an economic recovery. Subsequently, growth rates subside as momentum reverts to the norm. In the current cycle, peak growth occurred in 2010.
The chart summarises the current situation by averaging usage rates across several key commodities - aluminium, copper, zinc, nickel, lead, steel and oil - since 2010 ( in the red line) and for each cycle since 1960 (in the blue line) for the same group of products.
As markets advance through this slowing growth phase, a rebalancing that will result in a change in price expectations becomes increasingly difficult to achieve.
As the year progresses, relatively modest gains in raw material usage rates are being detailed by the industry statistics.
 Estimates
of zinc usage by the International Lead Zinc Study Group for the first five
months of 2015 are 2.6% higher than the estimate for the corresponding
period of 2014. This compares with growth of 4½ - 5% in each of 2013 and
2014.
Estimates
of zinc usage by the International Lead Zinc Study Group for the first five
months of 2015 are 2.6% higher than the estimate for the corresponding
period of 2014. This compares with growth of 4½ - 5% in each of 2013 and
2014.
The slowdown is even more marked in the copper market. The International Copper Study Group has estimated that usage in the first four months of 2015 has been 3.8% lower than in the corresponding period of 2014.
The World Steel Association has reported a 2.4% decline in crude steel production during the six months ended June 2015. In the critical China market, production over the first six months of 2015 is little changed but slightly negative. The chart highlights how monthly steel production in the Asian giant in 2015 has largely tracked the result in 2014.
These trends still leave outcomes near records after lengthy periods of strong growth, in some cases. Nonetheless, the flow of statistics continues to highlight that some expectations about underlying market strength may have to be trimmed. The statistics also suggest that the momentum which might catch the eye of equity investors to help rebuild interest in the commodity segment is currently absent .