The Current View
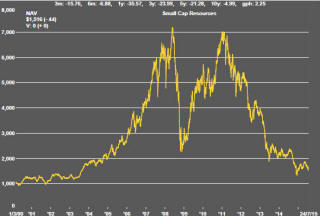
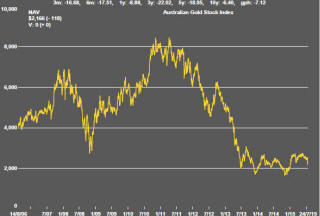
A lengthy downtrend in sector prices had given way to a relatively stable trajectory after mid 2013 similar to that experienced in the latter part of the 1990s and first few years of the 2000s.
The late 1990s and early 2000s was a period of macroeconomic upheaval during which time sector pricing nonetheless proved relatively stable. That remains a possible scenario for sector prices.
Relative stability suggests a chance for companies genuinely adding value through development success to see their share prices move higher. This was the experience in the late 1990s and early 2000s.
The lower equity prices fall - and the higher the cost of capital faced by development companies - the harder it becomes to justify project investments. The market is now entering a period prone to even greater disappointment about project delivery .
Has Anything Changed?
The assumption that June 2013 had been the cyclical trough for the market now appears premature.
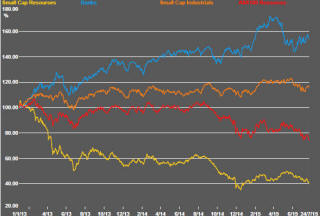
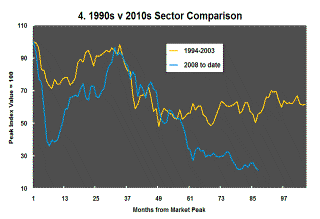
Sector prices have adjusted to the next level of support. The parallel with the 1990s illustrated in Chart 4 is being tested. Prices will have to stabilise around current levels for several months for the thesis to hold.
Key Outcomes in the Past Week
There was no dominating influence in the past week as China, Greece and Iran seemed to diminish in importance but the mix of background factors offered an overall negative tone.
U.S. and European earnings reports have started to reflect increasingly slow global growth patterns. International companies are reporting slackening sales in China and South America. Forward guidance is being wound back as pessimism about these regions of spreads. The change is not dramatic but evident enough to dampen market spirits among traders looking for more positive signs.
A handful of companies are driving the U.S. market indices with the leading new technology companies conspicuously at the forefront. Sectors such as energy, transport and basic materials which rely on broad based economic improvement (rather than market disruption) have been lagging.
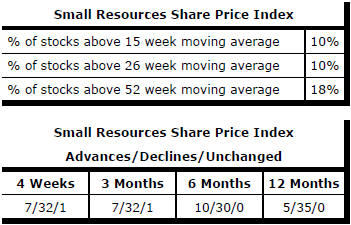
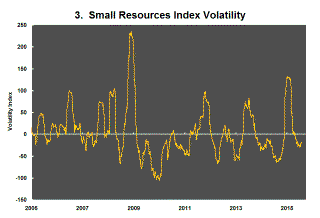
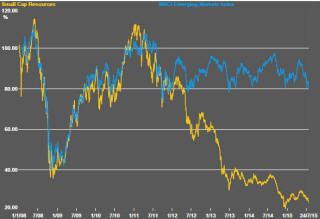
Signs of further cyclical deterioration have aggravated the already poor performance of basic material equity prices. Some of the larger resources stocks had been taking the brunt of the recent sector re-pricing but the smaller stocks were once again drawn into the market volatility. The downward move in the sector volatility indicator shown in chart 3 opposite had begun to stall and showed signs of changing direction - usually a sign of worse things to come - during the week. The small resources share price index fell 8.3% while the S&P/ASX 100 resources index fell 5.1%.
Australia’s listed resources companies will again be reporting perilously low cash positions over the next few days in their June quarter updates. Fewer than one in ten of the companies required by ASX to report quarterly cash positions had enough funding at the end of March to make it through another year, according to a compilation of the reports from international accounting firm BDO.
These smaller companies are edging closer to the point at which possibly dozens or even hundreds cease any meaningful exploration or development activities while awaiting more favorable macro conditions.
Falling precious metal prices are causing disproportionate falls in the prices of producing companies as margins are squeezed. Companies may choose to lower costs more aggressively but this is likely to occur at the cost of shorter mine lives and inevitably imply still lower market values even as companies may become more profitable in the short term. .
Market Breadth Statistics