The Current View
Growth in demand for raw materials peaked in late 2010. Since then, supply growth has continued to outstrip demand leading to inventory rebuilding or spare production capacity. With the risk of shortages greatly reduced, prices have lost their risk premia and are tending toward marginal production costs to rebalance markets.
To move to the next phase of the cycle, an acceleration in global output growth will be required to boost raw material demand by enough to stabilise metal inventories or utilise excess capacity.
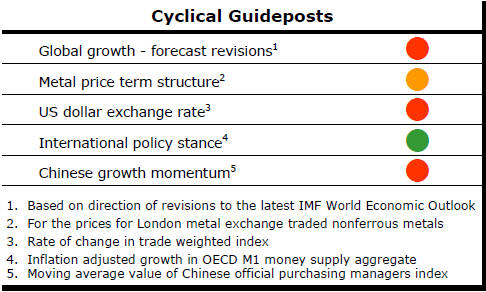
The PortfolioDirect cyclical
guideposts suggest that the best possible macroeconomic circumstances for
the resources sector will involve a sequence of upward revisions to
global growth forecasts, the term structure of metal prices once again
reflecting rising near term shortages, a weakening US dollar, strong money
supply growth rates and positive Chinese growth momentum. Only one of
the five guideposts is "set to green" suggesting the sector remains confined
to the bottom of the cycle .
Has Anything Changed? - Updated View
Since mid 2014, the metal market cyclical position has been characterised as ‘Trough Entry’ as prices have remained in downtrend with all but one of the PortfolioDirect cyclical guideposts - the international policy stance - flashing ‘red’ to indicate the absence of support.
The absence of a global growth acceleration, a stronger dollar and flagging Chinese growth momentum remain critical features of the current cyclical positioning.
Through February 2016, the first signs of cyclical improvement in nearly two years started to emerge. After 15 months of contango, the metal price term structure shifted to backwardation reflecting some moderate tightening in market conditions.
The metal price term structure is the most sensitive of the five cyclical guideposts to short term conditions and could, consequently, quickly reverse direction. Nonetheless, this is an improvement in market conditions and the guidepost indicator has been upgraded to ‘amber’ pending confirmation of further movement in this direction.
Is it still doom and gloom in Australian mining?
Mines and Money Asia has provocatively set the scene for its discussion
about the outlook for Australia’s mining industry with a question that could
open some deep wounds among Australia’s mining fraternity.
Perceptions of all-enveloping gloom hide many points of light. The potential of a new nickel province in the Fraser Range is one illustration of why the industry has a strong future. Explorers are literally just scraping the surface of the nation’s mineral wealth.
Vanadium Australia and Potash West are just two companies in Western Australia embarking on high quality projects which do not need a voracious Chinese appetite for raw materials to sustain their development. This is a newly emerging theme.
There are explorers like Impact Minerals and St George Mining offering high quality discovery opportunities.
Then, there are the Australian companies leading developments offshore. The Bannerman Resources uranium project in Namibia is positioned to take advantage of the upcoming surge in nuclear power usage. At an earlier stage, Deep Yellow is pursuing an exploration model nearby with a likely low capital intensity development. Kasbah Resources has one of the few hard rock tin mines on the development horizon anywhere in the world. In South America, Orocobre is now one of the few fresh sources of lithium to meet the burgeoning demand from the battery storage industry.
On the gold front, cash margins in the vicinity of A$500/oz have become increasingly common with a lowered Australian dollar exchange rate.
One of the consequences of the cyclical downturn has been a cost windfall for the explorers and smaller scale mine developers who can now access needed services more readily and less expensively.
There is more diversity in the modern day Australian mining industry. Return prospects are better than they have been with an unprecedented emphasis on capital efficiency.
These are points of light rather than rays of sunshine. Over the last 15 years, A$607 billion has been spent by Australia’s mining industry on exploration and project development within the country, according to the Australian Bureau of Statistics. Over the 12 months to December 2015, these projects generated profits before tax of $26.1 billion, a meagre 4.3% return on the capital they consumed over the prior 15 years. The industry is failing to pay its way. Even in the unlikely event of an imminent cyclical upturn, it would face difficulty ever making up the deficiency.
The resources industry has accounted for more than 25% of the nation’s capital spending over the past decade. The huge spending bias has drained resources from other industries which now stand no chance of recovering from the resulting damage.
Official forecasters feeding off the biases of the industry encouraged successive governments to tie their spending decisions to the same bad judgements. Rebalancing public sector budgets could now take decades.
The sources of gloom do not end there. The cyclical underpinnings to the industry’s predicament appear unusually prolonged. Progress along the cyclical path requires an acceleration in global growth. All major economic regions are battling to sustain current growth rates. Nowhere are policymakers fearful of growth running out of control, the normal signal of a fresh cycle.
Many hundreds more companies than in the earlier stages of the last cycle are now searching for capital. Conspicuously, the number of investible projects has not risen commensurately leaving scores more duds to deter investor interest.
The work of Richard Schodde at Minex Consulting suggests that the industry’s historical average of 15-20 meaningful mineral discoveries in a year has fallen. Even if the discovery rate is sustained, over 900 listed companies will be unsuccessful in any year. In an implausible scenario in which all existing listed companies eventually succeed, the prevailing discovery rate implies a 30 year wait for some investors before they could reap the benefits of their participation in the industry.
The available technical and managerial skill base has been spread more thinly than ever as a result of the flood of newly formed companies. There are not enough capable people to populate this corporate universe and meet the expectations being created. This further saps the enthusiasm of potential investors to back the sector.
Structural changes in the domestic capital market have also diverted the industry’s funding pipeline. These changes go well beyond a response to the cyclical condition of the industry which is harmful enough on its own.
Australian pension funds have captured the bulk of the huge increase in the savings of Australian individuals. The mining industry has missed out on its share of the almost two trillion dollars that have flowed into pension funds. Beyond the reasons cited above, the industry has failed to connect with the gatekeepers to this burgeoning pool of money. The vast bulk of the industry continues to use a capital raising model rooted in the 1980s which has long since outlived its usefulness.
The stockbrokers on whom the industry typically relies to source capital have dramatically lost their historical access to the savings of individuals. Moreover, the compliance regime imposed on them and the financial advisers who have supplanted them as conduits to the market mitigates against investment in the sector.
There was a time when brokers would have prided themselves on identifying new mining investment prospects to add spice to their clients’ portfolios. Under today’s brutally strict compliance regimes, most financial advisers would risk being sacked or jailed if they behaved in the same way as a broker did in the 1980s or 1990s. The Australian mining industry has been largely oblivious to these changes.
Paradoxically, investible savings have never been more abundant and capital has flowed most freely to where sector returns are proving most inadequate. Companies seeking funding are failing to meet the challenges thrown up by the structure of the modern capital market. The resulting gloom is needlessly shrouding the points of light emanating from deserving projects.