The Current View
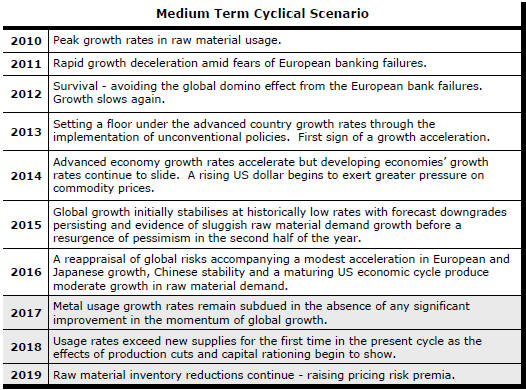
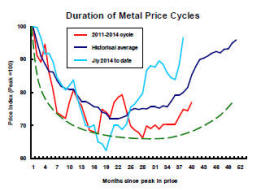
Growth in demand for raw materials peaked in late 2010. Since then, supply growth has generally outstripped demand leading to inventory rebuilding or spare production capacity. With the risk of shortages greatly reduced, prices lost their risk premia and have been tending toward marginal production costs to rebalance markets.
The missing ingredient for a move to the next phase of the cycle is an acceleration in global output growth which boosts raw material demand by enough to stabilise metal inventories or utilise excess capacity.
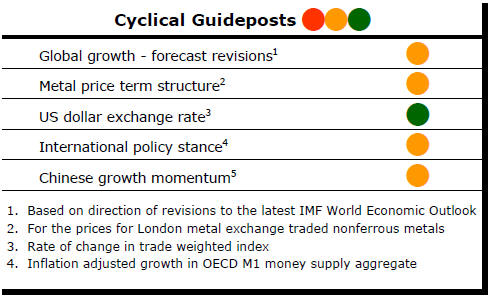
The PortfolioDirect cyclical
guideposts suggest that the best possible macroeconomic circumstances for
the resources sector will involve a sequence of upward revisions to
global growth forecasts, the term structure of metal prices once again
reflecting rising near term shortages, a weakening US dollar, strong money
supply growth rates and positive Chinese growth momentum. Only one of the five guideposts is "set to green"
(after the most recent adjustments in July 2017) suggesting the sector remains confined
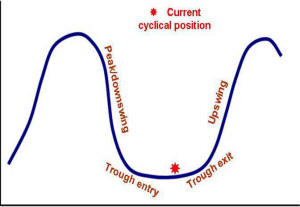
to near the bottom of the cycle.
Has Anything Changed? - Updated View
From mid 2014, the metal market cyclical position was characterised as ‘Trough Entry’ with all but one of the PortfolioDirect cyclical guideposts - the international policy stance - flashing ‘red’ to indicate the absence of support.
Through February 2016, the first signs of cyclical improvement in nearly two years started to emerge. The metal price term structure reflected some moderate tightening in market conditions and the guidepost indicator was upgraded to ‘amber’ pending confirmation of further movement in this direction.
As of early December 2016, the Chinese growth momentum indicator was also upgraded to amber reflecting some slight improvement in the reading from the manufacturing sector purchasing managers index. Offsetting this benefit, to some extent, the policy stance indicator was been downgraded from green to amber.
The most recent change in cyclical guidepost positioning has been at the end of July 2017 when the exchange rate guidepost was upgraded to green.
IMF Flags Better Growth
The global growth picture is improving.
Interviewed on the sidelines of the Jackson Hole meeting of central bank officials last week, International Monetary Fund (IMF) chief economist Maury Obstfeld was as upbeat about the global outlook as anyone in his position for the best part of a decade.
The more optimistic outlook is the latest phase of a prolonged forecasting evolution.
A preoccupation with downside risks initially brought repeated forecast downgrades.
The risks eased but the downgrades persisted as structural impediments and political forces (often reflected in weak productivity) took their toll on growth.
More recently, the extent of downgrades in overall growth have lessened but the composition of growth has been mixed. Upgrades in places have been offset by lowered growth forecasts elsewhere.
The global economy may only just be reaching the point at which multiple regions are expanding in concert.
Under these circumstances, a benign feedback loop is more likely to encourage further strengthening in growth which may produce the occasional upside surprise outcome.
These are the most favourable circumstance for resource sector investments.
Obstfeld was deliberately coy when asked whether the Fund was going to raise its growth forecasts at the time of its next review scheduled for release in October.
Pushed, he was prepared to go no further than saying he did not expect to see the forecasts lowered once they are finalised in a few weeks.
This important step in the evolution of the commodity cycle would be consistent with the current positioning shown in the recent strengthening of the principal metal markets.
The extent to which forecasts are revised on the next occasion and whether they can be raised in successive rounds will indicate something about the ongoing strength of the current cycle.
Monetary conditions have been playing a disproportionate role in recent economic outcomes through their impact on inflating asset values.
With monetary accommodation being wound back in the USA (and possibly in Europe without as significant a lag as once throught), the sustainability of asset prices will be tested even as the growth outlook improves.
Tightening monetary conditions have marked the late stage of a cycle in the past, not the beginning .
Copper Ignores Bond Market Lead
Copper prices and bond yields usually feed off some of the same market
signals.
Both are likely to respond positively to more buoyant
growth expectations. Higher commodity prices accompanying
strengthening inflation pressures are likely to drive bond yields higher.
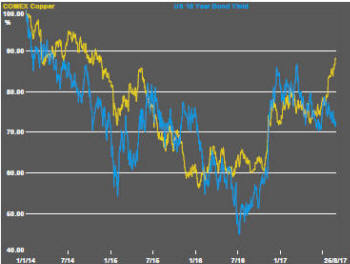
The recently growing divergence between copper prices and bond yields, against this background, is surprising.
A divergence is not unprecedented but there is some tendency for any gap to be quickly shut.
Currently, bond yields are implying some scepticism about the growth outlook. Metal prices are implying the opposite.
Of course, the big swing influence has been a currency adjustment which has taken the U.S. dollar to around its lowest levels in over two years.
Growth aside, such a currency adjustment would normally help boost metal prices which might explain some of the unusually large gap.
That still leaves open a question about what influence will play the dominant role in setting future metal prices.
If recent copper prices have been primarily a monetary phenomenon rather than a reflection of the real economy - and the bond market interpretation is well based - the sector faces a potentially awkward adjustment.
The best case scenario for the commodity sector involves a seamless transition between the beneficial effects of monetary conditions and longer term support from higher output growth.
There is no reason why this cannot happen but remains an outcome heavily discounted currently by financial markets.
US manufacturers Improve Slowly
The U.S. Department of Commerce has reported a 0.4% increase in
manufacturers' new orders of non-defence capital goods (excluding aircraft).
Orders in July were 3.5% higher than a year earlier.
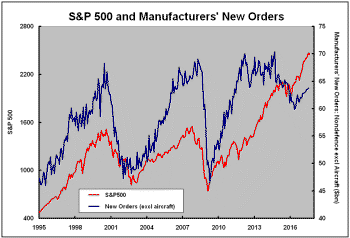
Over the last 20 years, the ebbs and flows of the capital ordering cycle have coincided with directional shifts in equity prices.
The slump in orders through the course of 2015 coincided with the weakest equity market investment returns since 2009.
A strengthening in the flow of orders has more recently coincided with stronger equity prices but the stronger market has come with a relatively modest expansion in orders suggesting something more to the market gains than an improvement in underlying economic conditions.
The impact of monetary conditions on asset prices will have been one contributor to the higher than expected market oucomes. Promised corporate tax reductions and infrastructure spending programs, designed to boost overall growth, will have also affected anticipated market outcomes.
One of the outstanding questions about the forthcoming U.S. economic performance will be whether the momentum within the real economy will compensate for the withdrawal of monetary stimulus over the coming year or so.
Right now, real economic outcomes do not look strong enough.
.