The Current View
Growth in demand for raw materials peaked in late 2010. Since then, supply growth has continued to outstrip demand leading to inventory rebuilding or spare production capacity. With the risk of shortages greatly reduced, prices have lost their risk premia and are tending toward marginal production costs to rebalance markets.
To move to the next phase of the cycle, an acceleration in global output growth will be required to boost raw material demand by enough to stabilise metal inventories or utilise excess capacity.
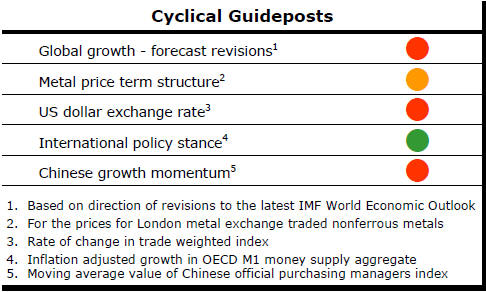
The PortfolioDirect cyclical
guideposts suggest that the best possible macroeconomic circumstances for
the resources sector will involve a sequence of upward revisions to
global growth forecasts, the term structure of metal prices once again
reflecting rising near term shortages, a weakening US dollar, strong money
supply growth rates and positive Chinese growth momentum. Only one of
the five guideposts is "set to green" suggesting the sector remains confined
to the bottom of the cycle .
Has Anything Changed? - Updated View
Since mid 2014, the metal market cyclical position has been characterised as ‘Trough Entry’ as prices have remained in downtrend with all but one of the PortfolioDirect cyclical guideposts - the international policy stance - flashing ‘red’ to indicate the absence of support.
The absence of a global growth acceleration, a stronger dollar and flagging Chinese growth momentum remain critical features of the current cyclical positioning.
Through February 2016, the first signs of cyclical improvement in nearly two years started to emerge. After 15 months of contango, the metal price term structure shifted to backwardation reflecting some moderate tightening in market conditions.
The metal price term structure is the most sensitive of the five cyclical guideposts to short term conditions and could, consequently, quickly reverse direction. Nonetheless, this is an improvement in market conditions and the guidepost indicator has been upgraded to ‘amber’ pending confirmation of further movement in this direction.
Monetary Conditions still Dominant
Global economic policy remains overwhelmingly fixated on monetary conditions
and, consequently, still unable to affect the growth outcomes on which the
mining industry relies to rebalance markets.
Cycles happen when demand for raw materials moves unexpectedly. The cyclical positioning of commodity markets is under little pressure to change. In a slow growth world, miners have longer to adjust to demand growth reducing the chance of price upside arising from concerns about shortages.
US Growth Uncertainties
The U.S. economy continued to show patchy results which helps explain why
overall growth rates are so modest.
 Weekly
jobless claims continue to fall but are now on a slowing downtrend. This is
one signal that the economy is edging closer to a higher interest rate
environment. The chart shows the jobless claims (in the blue line on the
inverted right hand axis) and movements in the S&P 500 equity price index.
Weekly
jobless claims continue to fall but are now on a slowing downtrend. This is
one signal that the economy is edging closer to a higher interest rate
environment. The chart shows the jobless claims (in the blue line on the
inverted right hand axis) and movements in the S&P 500 equity price index.
The labour statistics are a proxy for business conditions as well as for household spending power and indicate a positive underpinning for the broader equity market.
The slowdown in the rate of labour market improvement is a worry insofar as it signals the end of the cycle of improvement is drawing nearer.
In contrast to the labour market improvement,
manufacturing conditions appear to have been worsening. The latest
statistics for manufacturers’ new orders show a 1.6% gain in July but this
was one of only six monthly increases over the past 12 months. Over the
year, new orders have dropped 4.9%.
In earlier cycles, the equity market would have begun falling against such a background and might have done so once again without the support of the Federal Reserve.
This disparity between labour market improvement and business sales conditions highlights the dilemma facing the Federal Reserve in deciding whether to raise interest rates.
The disparity also highlights the emphasis on services in the country’s growth make-up and the resulting weakening productivity trends.
Gold Prices - Not Like 1980s?
Gold bullion prices fell in the past week but are some US$300/oz higher than
at the end of December 2015.
It is tempting to infer a continuing uptrend in the gold price based on the performance over the past eight months.
 There
are circumstances in which a higher gold price over coming months is
feasible but the price pattern over the past 12 months also bears a strong
resemblance to the price action in 1982-83.
There
are circumstances in which a higher gold price over coming months is
feasible but the price pattern over the past 12 months also bears a strong
resemblance to the price action in 1982-83.
In both cases, the gold price had risen dramatically in the aftermath of large shifts in the geographical distribution of global income. In the first period, the income shifts reflected the emergence of Middle East oil wealth. In the second case, the change arose from the rapid emergence of China as an economic power.
In the early 1980s, the gold market began to search for a new sustainable level. That search initially involved a failed attempt to revert to earlier peak prices (retrieving 47% of the earlier loss) which was followed by a series of diminishing upward moves as prices settled into a narrower trading range which extended for two decades.
While many will wish for something different and while alternative scenarios could prevail, the most recent price action remains reminiscent of the adjustment in the early 1980s and consistent with gold prices being little changed over coming years in the absence of another strategic shift in income flows.
So far, the most recent rebound accounts for 38% of the losses going into late 2015 leaving scope for some further increase in prices while still being consistent with a 1980s-style adjustment.
China G20 Meeting to Look for Growth
China is hosting the G20 this year but the group has been disappointingly
ineffective in achieving improved economic outcomes.
Two years ago, under Australian leadership, an attempt to provide better global growth outcomes was initiated. That move has largely been shunted aside as governments have failed to take hard decisions to reform microeconomic policies to improve productivity.
Chinese leaders will be keen to refocus on growth outcomes to relieve some of the pressure they face to stimulate the Chinese economy. They will also want to avoid discussion about the regional tensions and animosities which threaten to distract attention from the economic issues.
The U.S. and Japan, in particular, will be wary about China taking credit for any growth initiatives or, more generally, enhancing its international standing at their expense.
Geopolitical manoeuvring could easily dominate outcomes at the upcoming leaders meeting this year and confirm the ineffectiveness of concerted international government action to improve global growth outcomes.