The Current View
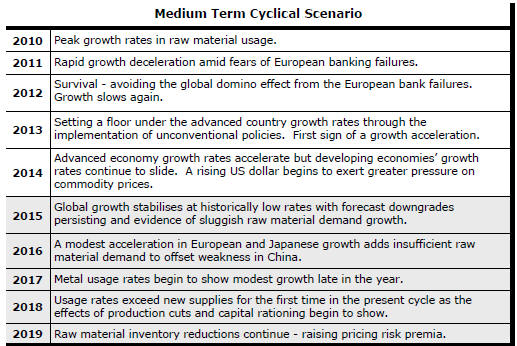
Growth in demand for raw materials peaked in late 2010. Since then, supply growth has generally outstripped demand leading to inventory rebuilding or spare production capacity. With the risk of shortages greatly reduced, prices lost their risk premia and have been tending toward marginal production costs to rebalance markets.
The missing ingredient for a move to the next phase of the cycle is an acceleration in global output growth which boosts raw material demand by enough to stabilise metal inventories or utilise excess capacity.
The PortfolioDirect cyclical
guideposts suggest that the best possible macroeconomic circumstances for
the resources sector will involve a sequence of upward revisions to
global growth forecasts, the term structure of metal prices once again
reflecting rising near term shortages, a weakening US dollar, strong money
supply growth rates and positive Chinese growth momentum. None of the five guideposts is "set to green"
(after the most recent adjustments in December 2016) suggesting the sector remains confined
to near the bottom of the cycle.

Has Anything Changed? - Updated View
From mid 2014, the metal market cyclical position was characterised as ‘Trough Entry’ with all but one of the PortfolioDirect cyclical guideposts - the international policy stance - flashing ‘red’ to indicate the absence of support.
Through February 2016, the first signs of cyclical improvement in nearly two years started to emerge. The metal price term structure reflected some moderate tightening in market conditions and the guidepost indicator was upgraded to ‘amber’ pending confirmation of further movement in this direction.
As of early December 2016, the Chinese growth momentum indicator was also upgraded to amber reflecting some slight improvement in the reading from the manufacturing sector purchasing managers index. Offsetting this benefit, to some extent, the policy stance indicator has been downgraded from green to amber. While monetary conditions remain broadly supportive, the momentum of growth in money supply is slackening while further constraints on fiscal, regulatory and trade regimes become evident.
Project Funding Becomes Easier
to Source
The global growth picture has improved but remains consistent with
a prolonged cyclical trough rather than an imminent upswing.
The PortfolioDirect report last week describing the latest International Monetary Fund (IMF)global growth forecasts highlighted the importance of a growth surprise as a precursor to a cyclical upswing.
By definition, a growth surprise is not anticipated but one can infer something about the balance of risks to the growth outlook from the flow of data.
The IMF has described the balance of risks as still tilted to the downside. While the risks to growth appear less threatening than they have done at other times over recent years, the constraints on an acceleration do appear unusually heavy.
A rethink by the economics profession of world growth potential comes against a backdrop of systemic financial risks, flagging productivity growth, subsiding demographic momentum and lukewarm support among governments for microeconomic reform.
Among the currently perceived added threats to growth is a contraction in the volume of world trade over the coming two years aggravated by an apparent hostility among newly installed US policymakers toward liberalising trade agreements which fail to confer obvious economic benefits on the USA.
Output growth, especially when it is driven by a higher proportion of investment spending, is the source of demand for higher volumes of mine output and, to that extent, underpins the funding and construction of new mines.
The momentum of growth also creates expectations about the future. While perceptions about future demand may prove inaccurate, they may still be important influences on the cost of capital and the willingness of financiers to commit funding to projects.
The funding outlook for the industry is improving despite official U.S. interest rates being on the rise as years of abnormal monetary support for growth are withdrawn.
Expectations of stronger U.S. growth and higher inflation have caused government bond yields to rise by as much as 120 basis points since July 2016.
Recent interest rate movements would normally feed into a higher cost of capital for mine developments but, on this occasion, the sources of these higher rates are also benefiting the mining sector.
Over the past 12 months, investors have re-embraced risk in their decision-making.
From a resources sector perspective, the risk reappraisal has been most evident in the price reaction among the largest stocks in the sector . At the small end of the market, any tendency to re-pricing has been more subdued and, in many cases, hard to discern.
One sign of a more positive attitude to risk still to
have an impact has been the steady decline in yields on lower rated
corporate bonds.

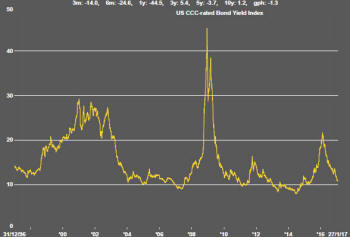
The Merrill Lynch index of yields on corporate bonds rated CCC or lower has declined from 22% a year ago to 11% presently with the downtrend still intact.
The earlier rise in yields during 2015 which coincided with the last leg of the slump in sector prices led to one of only three periods in the past 20 years of similarly high yields.
One such period was during the global financial crisis. The other was around the turn of the century when the 'tech bubble' was bursting and the U.S. economy was lurching into recession.
These were extreme global events with potentially dire consequences for the mining industry. The extent of the rise in yields during 2015, in this historical context, was indicative of the severe pressures on mining finance.
The reversion of yields to levels which display less risk aversion is a positive cyclical development for sector asset values.
Higher crude oil prices have been an important contributor to lower yields on corporate securities but, more generally, the move reflects greater optimism about the prospects of the natural resources sector as a whole.
While financial market conditions are more favourable, the growth picture leaves investors still inclined to discriminate. The search for quality has continued to limit the frequency of funding commitments.
The absence of a full-blown cyclical upswing which rewards miners indiscriminately may be no bad thing. Low quality projects may still struggle but stable growth in a more risk friendly funding environment offers a renewed chance for better quality mining development opportunities to gain investment traction.


