The Current View
Growth in demand for raw materials peaked in late 2010. Since then, supply growth has continued to outstrip demand leading to inventory rebuilding or spare production capacity. With the risk of shortages greatly reduced, prices have lost their risk premia and are tending toward marginal production costs to rebalance markets.
To move to the next phase of the cycle, an acceleration in global output growth will be required to boost raw material demand by enough to stabilise metal inventories or utilise excess capacity.
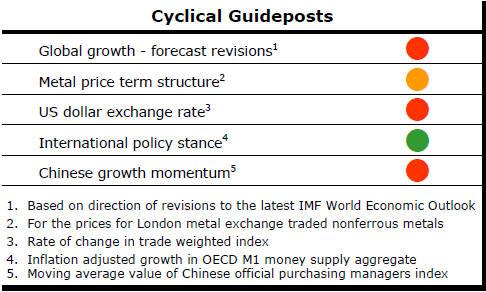
The PortfolioDirect cyclical
guideposts suggest that the best possible macroeconomic circumstances for
the resources sector will involve a sequence of upward revisions to
global growth forecasts, the term structure of metal prices once again
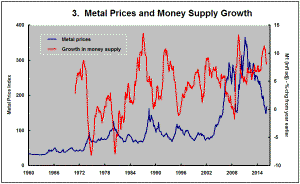
reflecting rising near term shortages, a weakening US dollar, strong money
supply growth rates and positive Chinese growth momentum. Only one of
the five guideposts is "set to green" suggesting the sector remains confined
to the bottom of the cycle .
Has Anything Changed? - Updated View
Since mid 2014, the metal market cyclical position has been characterised as ‘Trough Entry’ as prices have remained in downtrend with all but one of the PortfolioDirect cyclical guideposts - the international policy stance - flashing ‘red’ to indicate the absence of support.
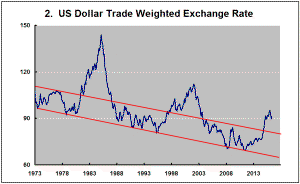
The absence of a global growth acceleration, a stronger dollar and flagging Chinese growth momentum remain critical features of the current cyclical positioning.
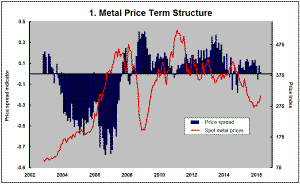
Through February 2016, the first signs of cyclical improvement in nearly two years started to emerge. After 15 months of contango, the metal price term structure shifted to backwardation reflecting some moderate tightening in market conditions.
The metal price term structure is the most sensitive of the five cyclical guideposts to short term conditions and could, consequently, quickly reverse direction. Nonetheless, this is an improvement in market conditions and the guidepost indicator has been upgraded to ‘amber’ pending confirmation of further movement in this direction.
Metal Prices Sag Again
There is still little to cheer resource sector investors from a cyclical
perspective with some further loss of momentum in metal prices.
The mix of influences remains much the same with little or no global growth momentum to rebalance markets. If anything, in the past week, conditions have worsened with the U.S. dollar pushing higher after expectations about the likely trajectory of interest rate normalisation changed once again.
Without the benefit of a cyclical path to guide decisions, investors are having to clutch onto whatever aids are at hand. For the time being, the outlook for lithium is the almost universal choice of those looking for an investment theme in the sector.
The weakness in the cycle which limits the flow of new investment money into the sector makes investment in lithium exposed companies a less certain source of returns and warrants additional caution about where in the sector funds should be directed.
The contrast between lithium exposed companies and those looking to develop uranium properties is illustrative of the need for care.
Lithium – Why Bet on the Impossible?
There’s not a snowball’s chance in hell that lithium market forecasts will
be realised. So, the question investors need to ask before joining the rush
is “What is really going to happen?”.
The lithium market is increasingly seen as the most robust of the metal markets depending little on the momentum of global economic activity and more on technological advances and attempts to use energy more efficiently.
Anticipated growth in demand of 10% a year for the next
decade is widely expected to run well ahead of industry production. Precise
forecasts of demand and supply vary among analysts but, to a person, the
graphical representations of the market look very similar to the chart below
from a recent Orocobre presentation.
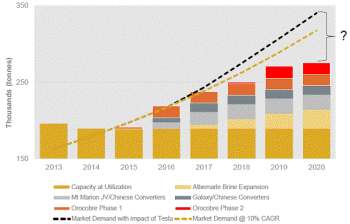
Almost in defiance of the laws of physics, the Orocobre chart shows demand for lithium running well ahead of the amount being produced. Of course, this is simply not possible. The forecast cannot be realised. The chart is an idealised form of analysis used to lure investors into a belief about the underlying strength of a market.
A serious investor needs to ask what is actually going to happen. Logically, there are barely a handful of potential outcomes.
Aggressive project development may lead to a more rapid rise in supply than is currently anticipated giving industrial users all they need. The conventional wisdom at this stage considers this an unlikely outcome although the queue of new entrants and supply potential grows by the week. Project gestation time is the constraining factor.
Manufacturers of batteries may neglect the potential damage to their businesses and compete aggressively for the limited available supplies. This would push up lithium prices as far as is necessary to choke off demand.
Lithium producers could connive in this outcome by adopting the BHP Billiton strategy of pricing their output on the spot market without regard to longer term relationships or value support.
Pursuit of this outcome assumes differing pain thresholds among battery makers. It implies that some will move to other technologies or be willing to postpone plans to take account of the timing of future production. Either way, the amount used will end up significantly below currently forecast levels. Almost certainly, this course will result in an eventual price collapse to around or below the production costs for the bulk of the industry as the battery makers take commercial revenge.
It is also possible that battery manufacturers use their relative economic strength to prevent a price free-for-all by contracting for what they can get and underwriting future production expansions in exchange for long term prices closer to costs of production.
Orocobre, which is already phasing up production, and others still planning an entrance expect production costs in the vicinity of US$2-3,000 per tonne compared with current prices extending past $10,000/tonne.
Investor excitement emanating from the prospect of the resulting margins shows how quickly investment market lessons are forgotten. The argument in favour of the gap between lithium production costs and prices being sustained is the same as the argument in favour of $150/tonne iron ore and $110/bbl crude oil prices.
Investors (or their advisers) rushing headlong into the lithium space are inviting the same investment fate as experienced with oil and iron ore so recently.
Investors are also prone to overlook a hardly ever mentioned lack of industry experience. With so few extant lithium production facilities globally, newcomers are learning on the job. Unfamiliarity with the mining and extraction techniques peculiar to the lithium industry poses an unusually high investment risk, even by the standards of the mining industry, of companies failing to meet development objectives within their targeted timeframes.
As Orocobre has shown, it is possible to face very high prices without production being able to take advantage of the opportunity. Indeed, selling prices may be high precisely because production targets cannot be achieved in which case investment outcomes will fail to reflect the apparent commodity price buoyancy.
Since mid February, the Global X lithium exchange traded
fund has risen 39%. In the absence of a sector-wide cyclical upswing which
relies on a continuing infusion of new investors, further gains are not
impossible but become harder to achieve. 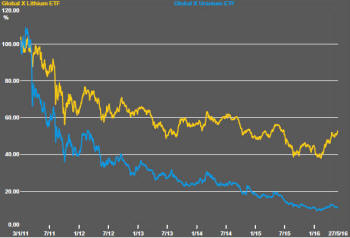
From a risk management standpoint, more opportune exposures such as in uranium (or even coal) may exist for value-oriented longer term investors.
The chart shows a 40 percentage point difference between the price histories of the Global X lithium and uranium exchange traded funds, in yellow and blue respectively, in favour of lithium since the beginning of 2011.
Much of the same back story attaches to the outlook for uranium demand as for the lithium market. The same excess demand pattern put forward as typical of the lithium market is expected from more widespread adoption of nuclear power.
Long lead times for power plant construction provide a high degree of confidence about the amounts of uranium needed. Indeed, investors may legitimately have greater confidence about the outlook for uranium use than the outlook for lithium.
In contrast with the lithium market, where there is an influx of potential new producers, uranium producers are battling to stay afloat and explorers are looking at commodities through which they can more easily source funding. Uranium prices are generally insufficient to validate new production.
Implicitly, investors have concluded that the prospective growth in uranium demand is too far into the future to warrant a repricing of equities presently. The Global X uranium ETF price is 2% below where it was at the beginning of 2016 and still trending lower despite sitting 90% below where it was at the beginning of 2011.
So strong is the lithium market that another 30-50% return from lithium exposed companies could be possible even as the rest of the mining industry languishes in a cyclical trough. Many explorers will display share prices highly leveraged to the announcement effect of lithium mineralisation within their tenements.
But the chance of a 50% gain from lithium could be significantly less than the chance of a 100% return from uranium exposed companies which would still leave them 80% below where they were at the beginning of 2011.
The framework within which investors are working warrants caution about too readily climbing on the lithium bandwagon without adequately weighting the relative risks and opportunities in a still cyclically weak market.