The Current View
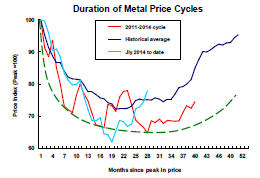
Growth in demand for raw materials peaked in late 2010. Since then, supply growth has continued to outstrip demand leading to inventory rebuilding or spare production capacity. With the risk of shortages greatly reduced, prices have lost their risk premia and are tending toward marginal production costs to rebalance markets.
To move to the next phase of the cycle, an acceleration in global output growth will be required to boost raw material demand by enough to stabilise metal inventories or utilise excess capacity.
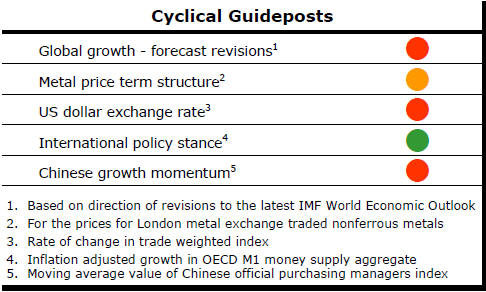
The PortfolioDirect cyclical
guideposts suggest that the best possible macroeconomic circumstances for
the resources sector will involve a sequence of upward revisions to
global growth forecasts, the term structure of metal prices once again
reflecting rising near term shortages, a weakening US dollar, strong money
supply growth rates and positive Chinese growth momentum. Only one of
the five guideposts is "set to green" suggesting the sector remains confined
to the bottom of the cycle .
Has Anything Changed? - Updated View
Since mid 2014, the metal market cyclical position has been characterised as ‘Trough Entry’ as prices have remained in downtrend with all but one of the PortfolioDirect cyclical guideposts - the international policy stance - flashing ‘red’ to indicate the absence of support.
The absence of a global growth acceleration, a stronger dollar and flagging Chinese growth momentum remain critical features of the current cyclical positioning.
Through February 2016, the first signs of cyclical improvement in nearly two years started to emerge. After 15 months of contango, the metal price term structure shifted to backwardation reflecting some moderate tightening in market conditions.
The metal price term structure is the most sensitive of the five cyclical guideposts to short term conditions and could, consequently, quickly reverse direction. Nonetheless, this is an improvement in market conditions and the guidepost indicator has been upgraded to ‘amber’ pending confirmation of further movement in this direction.
US Growth - Hardly Enough
The U.S. Department of Commerce has estimated that U.S. GDP grew at an
annualised rate of 2.9% in the September quarter or by 0.7% compared with
the June quarter estimate.
If confirmed after later revisions, the quarterly growth
rate will have been the strongest since the June quarter of 2014.
Having broken a succession of poor growth numbers, the September quarter outcome offers some hope that the overall pace of growth might more closely reflect the labour market improvement.
The disparity between output increases and employment growth has reflected a tepid recovery in manufacturing and a strong orientation toward services in the new jobs being created.
The growth outcome will have firmed views about a likely interest rate rise by the Federal Reserve before the end of 2016.
The September quarter GDP estimate was only 1.5% higher than GDP in the corresponding period in 2015, still a rather modest outcome by historical standards.
More importantly for cyclical conditions in the mining industry, the September quarter outcome on its own is insufficiently strong to suggest a meaningful improvement in the momentum of growth within the USA or that the U.S. growth outcome may contribute to better growth elsewhere.
Among the GDP components, capital spending remained weak. At just 12.5% of GDP in the quarter, private non-residential investment was falling and lower than at any time since 2013.
A fall in the capital intensity of GDP is usually a sign of deteriorating economic conditions or recession as in 1982, 2001 and 2008.
 The
positioning of the U.S. economy remains a worrying sign for a resources
sector in need of a pick-up in capital spending to support higher rates of
raw material demand.
The
positioning of the U.S. economy remains a worrying sign for a resources
sector in need of a pick-up in capital spending to support higher rates of
raw material demand.
The now imminent U.S. elections could be having an adverse effect on investment decisions, particularly against the backdrop of rhetoric from both sides about policy changes affecting investment spending and manufacturing jobs.
Much of what is being promised will make little difference but a Democrat in the White House with majorities in the Senate and House of Representatives would tilt the balance toward more public infrastructure spending.
Economists will debate the fiscal and debt implications of higher rates of government spending but public sector infrastructure spending would be a shot in the arm for the mining industry.
Unfortunately, any actual impact on raw material usage would be some time in coming. Nonetheless, Democrat political gains could easily result in an immediate positive impact on the share prices of those companies most likely to benefit from higher infrastructure spending. In the more liquid raw material markets, prices may also benefit from modified expectations about the outlook.
Inflation on the Rise
U.S. inflation is on the rise. The government has reported that the personal
consumption expenditure price index in September was 1.2% higher than a year
earlier, the highest rate of increase since late 2014.
The acceleration in the rate of price increase is
consistent with the intention of the Federal Reserve to raise inflation to
2% but it remains low and unlikely to cause any worry at the policy level.

On the contrary, there is some discussion among policymakers about letting inflation overshoot the target before attempting to rein it in again since bankers are more confident about the restraining effects of monetary policy on prices than on the capacity of interest rates to push them higher.
One of the contributors to a recent rise in bond yields has probably been the inflation rise. US 10 year bond yields have risen from as low as 1.36% in July to 1.85% at the end of last week amid some signs that financial markets are willing to normalize rates ahead of the willingness of the Federal Reserve to do the same with its policy settings.