The Current View
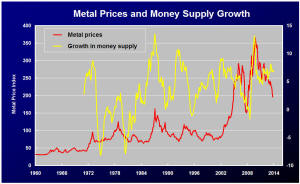
Growth in demand for raw materials peaked in late 2010. Since then, supply growth has continued to outstrip demand leading to inventory rebuilding or spare production capacity. With the risk of shortages greatly reduced, prices have lost their risk premia and are tending toward marginal production costs to rebalance markets.
To move to the next phase of the cycle, an acceleration in global output growth will be required to boost raw material demand by enough to stabilise metal inventories or utilise excess capacity.
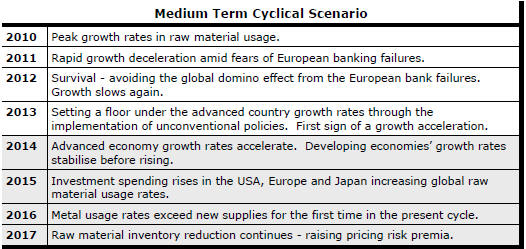
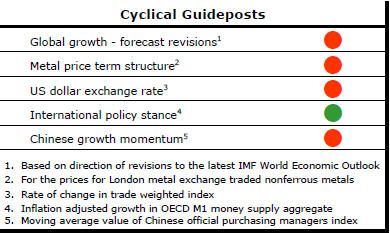
The PortfolioDirect cyclical
guideposts suggest that the best possible macroeconomic circumstances for
the resources sector will involve a sequence of upward revisions to
global growth forecasts, the term structure of metal prices once again
reflecting rising near term shortages, a weakening US dollar, strong money
supply growth rates and positive Chinese growth momentum. Only one of
the five guideposts is "set to green" suggesting the sector remains confined
to the bottom of the cycle .
Has Anything Changed?
Throughout 2014, PortfolioDirect had been characterising the cyclical position as ’Trough Entry’ with some expectation that by the end of 2015 an exit would be evident. Until very late in the year, the evidence supported that possibility before conditions took several backward steps.
The absence of a growth acceleration among the major economic regions other than the USA is contributing to the flagging momentum. A stronger US dollar is also imparting a downward bias to US dollar denominated prices presently. This is looking less like a temporary move than a multiyear change of direction.
The ECB has foreshadowed more monetary stimulus measures. However, monetary polices supporting asset prices alone are unable to directly affect growth sufficiently to encourage a better outlook for resource sector equities.
Fears about the impact of low oil prices have affected sentiment adversely. The beneficial effect of lower oil prices on demand within the advanced economies has not yet been felt and is still being underestimated as a source of additional output growth.
Yellen Says Why Rates Will Rise
Federal Reserve chair Janet Yellen lined up the goal posts in her post FOMC
meeting press conference as she outlined why rates may rise in the future:
"the Committee anticipates that it will be appropriate to raise the target
range for the federal funds rate when it has seen further improvement in the labor
market and is reasonably confident that inflation will move back to its 2
percent objective over the medium term".
for the federal funds rate when it has seen further improvement in the labor
market and is reasonably confident that inflation will move back to its 2
percent objective over the medium term".
The labour market criterion is clearly evidence based. The committee says it wants to see improvement before acting.
The second criterion - hitting the inflation target - is more of a faith-based indicator. The chart shows, for the Fed's preferred measure of inflation, the trajectory since 2000 (in blue) and the upper and lower bounds of the forecasts (in red) provided by the members of the FOMC and published after the meeting.
The forecasts suggest that the 2% inflation target will not actually be reached until 2017. The committee has said it needs to be confident that inflation will move. Presumably, if the views of the members eventuate, the Fed will not be absolutely confident for another two years.
The question that will intrigue markets from this point is when will the FOMC be confident enough and why to pull the interest rate trigger. A rising rate of wage increase, perhaps combined with a reversal in the current US dollar currency surge, may be telling factors but the ability of economists, as a group, to accurately anticipate the direction of inflation has been poor. Aggressive monetary policies have not stoked price increases in the way so many had anticipated. .
Delaying the Inevitable in the Oil Market
The apparent inconsistency between a dramatic 42% fall in the number of
operating oil rigs in the USA since October and a continuing rise in crude
oil production highlights the spread between the least productive and the
most productive wells in the US oil industry. The chart draws on weekly
Baker Hughes rig count data and production statistics from the US Energy
Information Agency.
The diversity in productivity rates has given the industry some short term flexibility in how it has reacted to lower oil prices. Closing down the least productive rigs to maximise production and cash flows have been rational responses but have kept downward pressure on market prices.
Currently high productivity wells will face diminishing
returns in
 due
course compromising the ability of owners to maintain cash flow and service
debt. Maintenance of production, requiring more capital, will become harder
to fund as financial institutions and investors generally become
increasingly wary about the risks.
due
course compromising the ability of owners to maintain cash flow and service
debt. Maintenance of production, requiring more capital, will become harder
to fund as financial institutions and investors generally become
increasingly wary about the risks.
The available evidence points to repetition of a common dilemma confronting commodity producers. What appears in their best short term interests in response to weakening markets heightens the pressures for a more dramatic adjustment at a later stage.
The interaction of falling productivity and heavily geared companies is an impending danger for investors. In its March quarterly review, the Bank for International Settlements has estimated that oil and gas companies' bonds outstanding increased from $455 billion in 2006 to $1.4 trillion in 2014. Syndicated loans increased from $600 billion to $1.6 trillion. Debt issuance by oil and other energy firms now makes up 15% of US debt indices, according to the BIS, up from less than 10% five years earlier and highlighting the extent to which this sector's borrowing has outstripped borrowing in other parts of the economy.
Much of this borrowing has been undertaken by state-owned integrated producers in Russia, China and elsewhere most likely to take advantage of low borrowing costs to effectively regear their balance sheets to improve equity returns.
The US company debt which accounts for around 40% of syndicated loans and debt securities involves smaller companies. The BIS analysis points to the ratio of debt to assets being largely unchanged for large US companies but almost doubling for other companies, including the small shale producers most vulnerable to the confluence of these events.