The Current View
Growth in demand for raw materials peaked in late 2010. Since then, supply growth has continued to outstrip demand leading to inventory rebuilding or spare production capacity. With the risk of shortages greatly reduced, prices have lost their risk premia and are tending toward marginal production costs to rebalance markets.
To move to the next phase of the cycle, an acceleration in global output growth will be required to boost raw material demand by enough to stabilise metal inventories or utilise excess capacity.
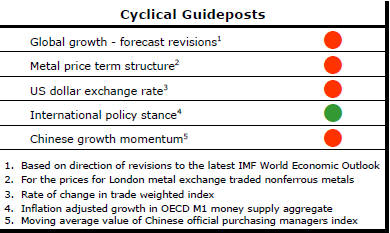
The PortfolioDirect cyclical
guideposts suggest that the best possible macroeconomic circumstances for
the resources sector will involve a sequence of upward revisions to
global growth forecasts, the term structure of metal prices once again
reflecting rising near term shortages, a weakening US dollar, strong money
supply growth rates and positive Chinese growth momentum. Only one of
the five guideposts is "set to green" suggesting the sector remains confined
to the bottom of the cycle .
Has Anything Changed?
Throughout 2014, PortfolioDirect had been characterising the cyclical position as ’Trough Entry’ with some expectation that by the end of 2014 an exit would be evident. Until very late in the year, the evidence supported that possibility before conditions took several backward steps.
The absence of a growth acceleration among the major economic regions is contributing to the flagging momentum. A stronger US dollar is also imparting a downward bias to US dollar denominated prices presently.
This change has been enough to define a fresh cycle and a more prolonged adjustment process.
IMF Revises Low Growth Lower
The International Monetary Fund once again cut back its near term global
growth forecast. Not only was the forecast for 2015 reduced by 0.2
percentage points but the growth rate now estimated for the year is 0.3
percentage points lower than the 2014 outcome.
Decelerating growth will normally imply the weakest phase in the raw material offtake cycle. The IMF’s interpretation of the world economy matches the trajectory implied by a range of steel and non ferrous metal industry statistics from such groups as the World Steel Association, the International Lead Zinc Study Group and the International Copper Study Group. They all show a dip in the rate of raw material offtake growth in 2015.
The momentum of forecast revisions is also of relevance to the outlook. Downward revisions will normally mean that the resources industry will have been overestimating demand and exaggerating the size of future market imbalances.
PortfolioDirect uses the momentum of global growth forecast revisions as one of its five cyclical guideposts used to define where we are in the cycle. Of the five indicators, only one currently implies forward cyclical momentum.
Euro Area Lending Lacks Strength
An inability to build momentum characterises a wide array of
European macro statistics. Recent PortfolioDirect
reports have noted euro area money supply and industrial production
statisics.
Loans outstanding - another measure of activity and willingness of business and consumers to spend - have recovered but are not growing significantly.
Loans taken out by non-financial corporations in the euro area have ceased contracting but increased by only 0.1% over the 12 months to August 2015. Household sector demand for loans has grown more rapidly. Outstanding amounts at the end of August were 1.5% higher than a year earlier.
Indian Rates Fall
The Indian central bank has announced a 50 point cut in its policy interest
rate.
At 4.4%, Indian inflation over the year to August needs
some ongoing downward pressure. At the same time, output growth is
accelerating but has the potential to go higher.
The Indian trade-off between growth and inflation is more like the problems that had confronted policymakers in the pre 2008 world than the combination of weak growth and threatening deflation faced by their counterparts today.
Unusually, too, in the case of India the central bank has the luxury of being able to manoeuvre interest rates lower to support stronger growth.
While this latest move has been described as unexpected,
the Reserve Bank governor had flagged in interviews in the USA recently the
possibility of further rate reductions as long as inflation was considered
under control leaving open scope for further action.